Cookies help us deliver our services. By using our services, you agree to our use of cookies.
You have no items in your shopping cart.
Filter by price
Products tagged with 'confirmation indicator'
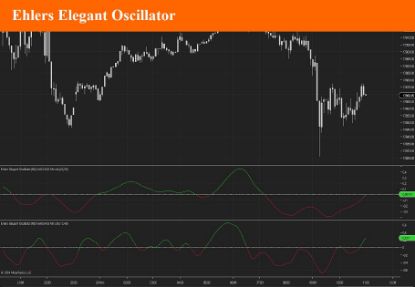
Ehlers Elegant Oscillator
The Elegant Oscillator was created by John Ehlers (Stocks and Commodities Feb 2022 p.21)
The Elegant Oscillator is founded on the idea that price tend to return to “normal”, or average levels of its historical mean. It calculates the inverse Fisher transform of price and then applies the SuperSmoother to filter market noise and create a signal line.
$9.90
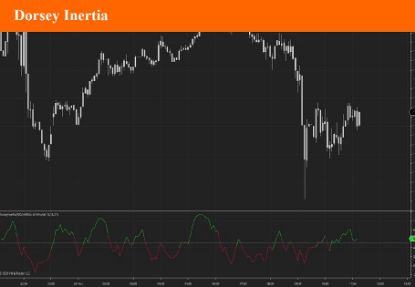
Dorsey Inertia
Developed by Donald Dorsey, the Inertia Indicator is an extension of Dorseys Relative Volatility Index and is used to define the long-term trend and how far it has extended. Its name refers to the physics term and its reference to direction and mass of motion.
Dorsey states that a trend is simply the “outward result of inertia” and as such, the market will require much more energy to reverse its direction than to extend the ongoing move.
$9.90
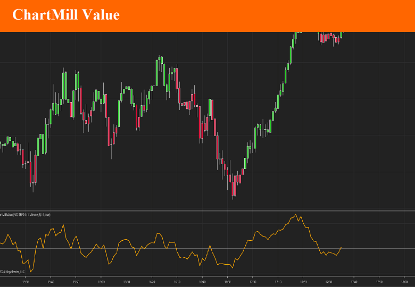
ChartMill Value
Developed by Dirk Vandycke, ChartMill Value indicator tracks how far the price spread is from its moving average. Since MA keeps increasing even when price consolidates or stalls, it is very difficult for the deviation from a moving average to remain in the overbought or oversold regions for extended periods, which represents a significant improvement over other oscillators such as the RSI and Stochastic indicators.
This indicator is best used with other oscillators, to confirm signals. Zero line crossovers should also be considered as signals.
This indicator will be able to colorize candles according to its trend (> 0 = up trend, < 0 down trend) and send alert when the zeroline is crossed.
$9.90
Top Bottom
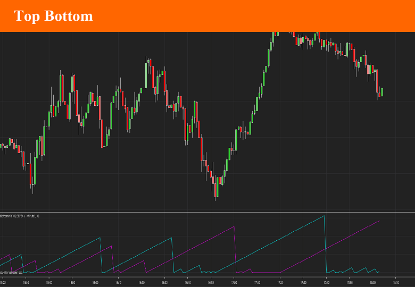
This indicator is a two line cross indicator. It searches for a specific occurrence where the current high price is larger than the last high price and is also larger than the high price a specified number of periods in the past. The same goes for the low.
It looks similar to the Aroon indicator but doesn't work the same way. They may be both used in conjunction.
Buy and Sell signal are given by the crossing of the Longsignal and ShortSignal Lines.
With this indicator you will be able to colorize canbdles according to the trend.
You may also receive alerts when the shjort and long lines are crossing.
$9.90
Glitch Index
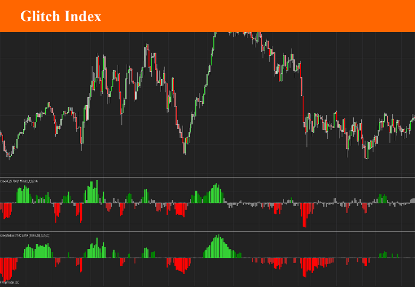
The Glitch Indicator, commonly referred to as the Glitch Index, is an oscillator used in technical analysis for trading. It was discovered in 2013 and is known for its ability to identify market trends, their strength, and potential reversals. Here are the key features and uses:
Market Trend Identification: The Glitch Index helps traders determine the current market trend, providing insights into whether the market is bullish or bearish.
Trend Strength and Reversals: It assesses the strength of a trend and indicates potential points where the trend might reverse .
Trend Filtering: The indicator includes a trend filter to screen out false signals, improving the reliability of the trends it identifies
$9.90
Double Donchian
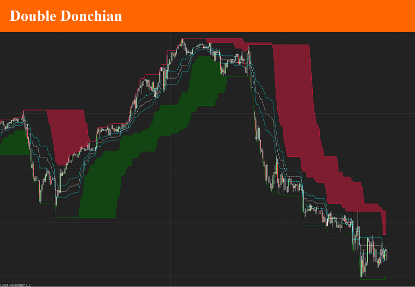
The double donchian indicator is the association between two donchian channel, each with different period parameter.
Using the fast and slow Donchian channels you'll be able to get long and short trading signals. When the price crosses the slow channel, open long or short positions. When the price crosses the fast channel again, close the positions.
You may also use it as a trend indicator by checking the differences between channel 1 low and channel 2 low values and channel 1 and channel 2 high value.
A set of 3 Fibonacci lines will complete this indicator.
$9.90
