Cookies help us deliver our services. By using our services, you agree to our use of cookies.
You have no items in your shopping cart.
Filter by price
Products tagged with 'moving average'
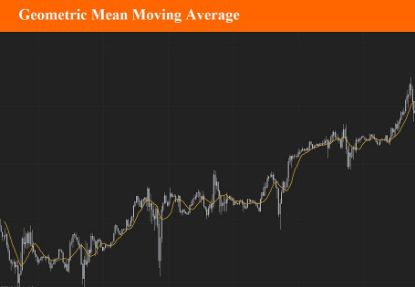
Geometric Mean Moving Average
The Geometric moving average calculates the geometric mean of the previous N bars of a time series. The simple moving average uses the arithmetic mean, which means that it is calculated by adding the time series' value of the N previous bars and then dividing the result with the lookback period. The geometric mean on the other hand is calculated by multiplying the time series' N previous values (multiplication is used instead of the addition) and then taking the N'th root product of the last result.
$9.90
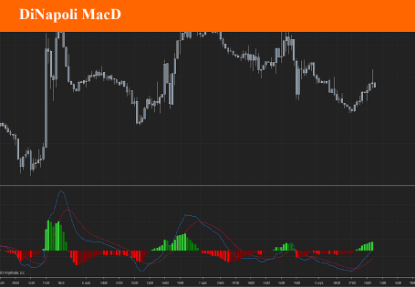
DiNapoli MacD (DEMA)
Dinapoli MacD is a trending indicator that give you not only what direction a market is moving but also how volatile the price is. When the market starts giving new max or minimum level values, the Dinapoli macd follows the price trend direction and pulls up the level of quit from the currency market . Stops should be applied where they are for a purpose, and in that case, should not be changed. The whole idea behind a practical trading plan is to keep it as simple as possible. There are two main advantages to its use. 1. You are able to determine, one period ahead of time, what price will cause theMACD to turn from a buy to a sell or visa versa. It is a cousin to the Oscillator predictor. If you take a position you know right then and there, the exact price, the current and next (future) bar will need to achieve for the MACD to cross. You can also literally see the distance the market has to go, before your current position is either helped or hindered by the force of the next MACD cross. You can do this in all time frames, as the indicator updates in real time. 2. You are able to determine the “Dynamic Pressure” on the market by clearly observing price action with the MACD history. Dynamic pressure refers to how the market reacts to buy and sell signals. If you get a 30 minute sell on the MACD and the market goes flat for example, you know right then and there that the next buy signal is apt to be a big winner! This was something I would regularly do with the standard DiNapoli MACD but now it is so much easier to see!
$9.90
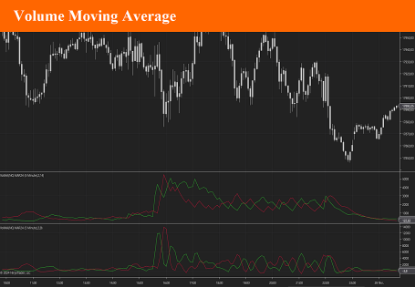
Volume Moving Average
Volume moving average is an indicator based on Ninjatrader Volume Up & Down. It applies a choice of 10 differents moving averages (DEMA, EMA, HMA, LinReg, SMA, TMA, TEMA, VWMA, ZLEMA and WMA). The result is displayed as an "oscillator like" indicator. Buy and sell signals are given in many different ways, so it's up to you to choose the one that suits you best.
$9.90
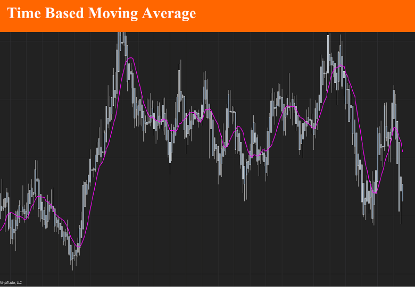
Time based moving average
A time-based moving average is a technique used to calculate the average of data points over a specific period. Unlike traditional moving averages that use a fixed number of samples, a time-based moving average adjusts based on the actual time that has passed. This method is useful in scenarios where data sampling intervals are irregular or where the importance lies in the time duration rather than the count of samples. This is mostly the case in non-time based timeframe such as Renko.
$9.90
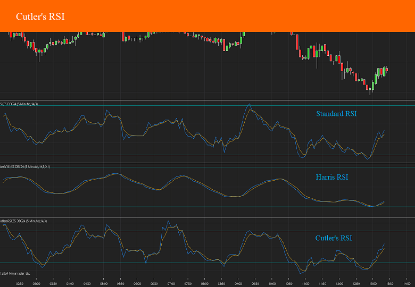
Cutler's RSI
Cutlers RSI is a simple moving average based version of the popular Relative Strength Index momentum oscillator which was developed by J. Welles Wilder and detailed in his book New Concepts in Technical Trading Systems. It analyses Average Gains and Average Losses to measure the speed and magnitude of price movements. The RSI is always between 0 and 100, with stocks above 70 considered overbought and stocks below 30 oversold. Divergence between the price and RSI can also be analysed for potential reversals. Average Gain is calculated as an SMA of the gains in the Period. The Average Loss is similarly calculated using Losses.
$9.90
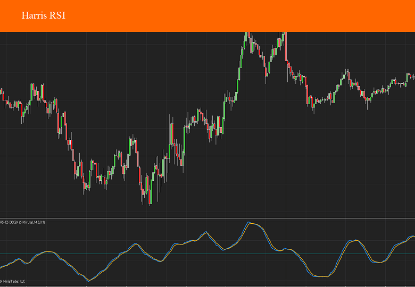
Harris RSI
Harris RSI is a variation of the standard Relative Strength Index (RSI) used in technical analysis. This indicator follows similar principles to the classic RSI by indicating overbought or oversold conditions in an asset, helping traders assess momentum and trend changes. However, specific features distinguish it: Trend OB/OS: It signals an uptrend when above the overbought level and a downtrend when below the oversold level. Overbought/Oversold Indicator: Values above a certain threshold (overbought) or below a certain threshold (oversold) indicate potential price reversals. 50-Cross Signal: Crossing above the 50 line suggests bullish momentum, while a drop below indicates bearish momentum[1]. This variant provides an additional layer of nuance for trend analysis, focusing on trend strength as well as reversal points.
$9.90
- 1
- 2
