Cookies help us deliver our services. By using our services, you agree to our use of cookies.
You have no items in your shopping cart.
Filter by price
Filter by manufacturer
Trend Indicators
In trading, trend refers to the direction of the price movement over an extended period of time. For example, when the price is consistently increasing, it’s an uptrend, and when it’s decreasing, it’s a downtrend.
Trend indicators can help determine the direction the market will take.
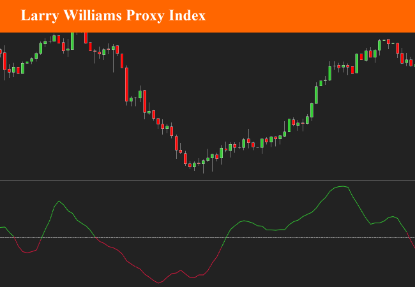
Larry Williams Proxy Index
Larry Williams Proxy Index (LWPI), sometimes just called one the Larry Williams Indicators is a confirmation indicator. First and foremost, Larry Williams has been revered as one of the founding father’s of modern trading, his career spanning over 40 years. He has published multiple books on trading, and his material featured in various trading magazine.
$9.90
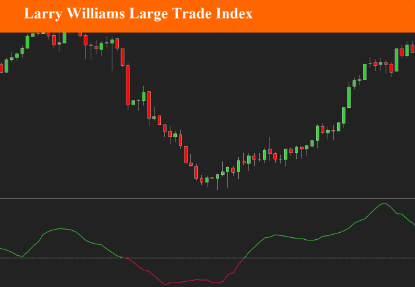
Larry Williams Large Trade Index
Larry Williams Large Trade Index (LWTI) is an indicatory by Larry Williams as explained in his book "Trade Stocks and Commodities with the Insiders: Secrets of the COT Report". The original concept was specifically based on Trader (or Market) Sentiment and predicting market reversals.
$9.90
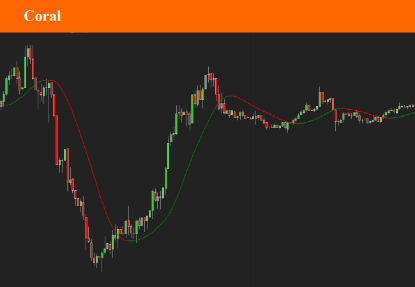
Coral
This indicator is considered a “confirmation indicator” which falls into the category of indicators that serve as an initial checkpoint after the baseline indicator provides you with a foundational signal. The Coral indicator is a combination of moving averages smoothed exponentially.
$9.90
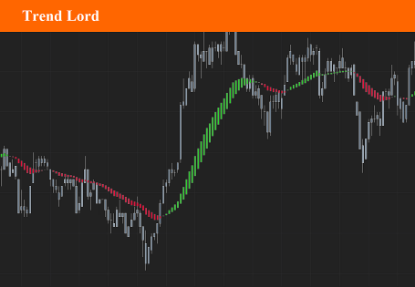
Trend Lord
The TrendLord indicator is a chart overlay indicator which can be used as a confirmation indicator. It is a derivative of a smoothed moving average but with the advantage of representing it as a colored change histogram.
$9.90
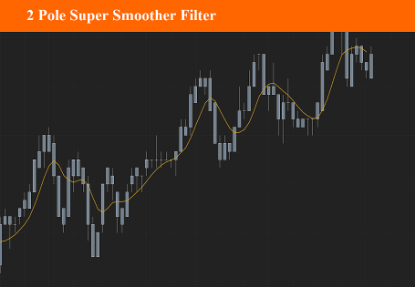
2 Pole Super Smoother Filter
The Two Pole Super Smooth Filter indicator is a moving average type trading indicator with smoothing filter. It was created by John Ehlers (Cybernetic Analysis For Stocks And Futures pg 202) and is one of his filters that follows the price very closely.
$9.90
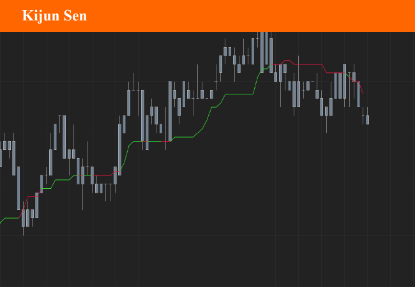
Kijun Sen
Kijun Sen is one of the most important lines of the ichimoku kinko hyo. Kijun Sen represents the average point of the last 26 periods. It is the average of the highest and lowest of the last 26 periods (last 26 candlesticks). The Kijun Sen forms steps. These landings are commonly called "Kijun flats". Kijun flats are important levels of support or resistance. Kijun Sen flats represent the 50% retracement level. Kijun Sen flat is equal to the 50% Fibonacci retracement level. In a trend phase (not in a range period) it is often relevant to consider buying or selling during pullbacks on the Kijun Sen.
$4.90
