Cookies help us deliver our services. By using our services, you agree to our use of cookies.
You have no items in your shopping cart.
Filter by price
Filter by manufacturer
Trend Indicators
In trading, trend refers to the direction of the price movement over an extended period of time. For example, when the price is consistently increasing, it’s an uptrend, and when it’s decreasing, it’s a downtrend.
Trend indicators can help determine the direction the market will take.
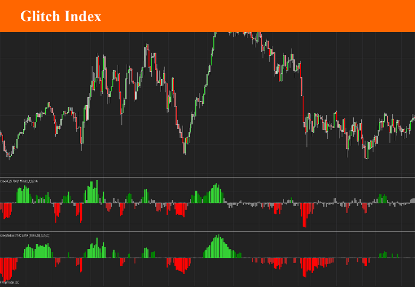
Glitch Index
The Glitch Indicator, commonly referred to as the Glitch Index, is an oscillator used in technical analysis for trading. It was discovered in 2013 and is known for its ability to identify market trends, their strength, and potential reversals. Here are the key features and uses: Market Trend Identification: The Glitch Index helps traders determine the current market trend, providing insights into whether the market is bullish or bearish. Trend Strength and Reversals: It assesses the strength of a trend and indicates potential points where the trend might reverse . Trend Filtering: The indicator includes a trend filter to screen out false signals, improving the reliability of the trends it identifies
$9.90
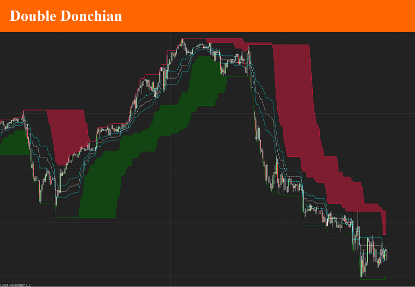
Double Donchian
The double donchian indicator is the association between two donchian channel, each with different period parameter. Using the fast and slow Donchian channels you'll be able to get long and short trading signals. When the price crosses the slow channel, open long or short positions. When the price crosses the fast channel again, close the positions. You may also use it as a trend indicator by checking the differences between channel 1 low and channel 2 low values and channel 1 and channel 2 high value. A set of 3 Fibonacci lines will complete this indicator.
$9.90
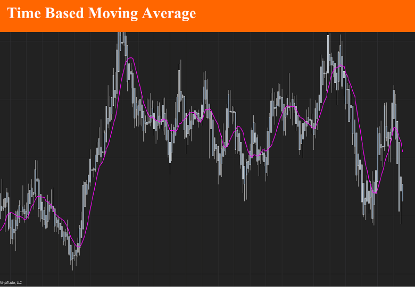
Time based moving average
A time-based moving average is a technique used to calculate the average of data points over a specific period. Unlike traditional moving averages that use a fixed number of samples, a time-based moving average adjusts based on the actual time that has passed. This method is useful in scenarios where data sampling intervals are irregular or where the importance lies in the time duration rather than the count of samples. This is mostly the case in non-time based timeframe such as Renko.
$9.90
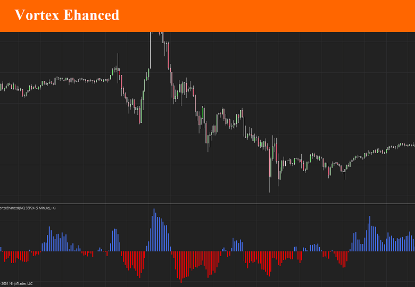
Vortex Ehanced
The Vortex Indicator is a technical analysis tool used in financial markets to identify the start of a new trend or the continuation of an existing trend. It was developed by Etienne Botes and Douglas Siepman in 2010 and is based on the work of J. Welles Wilder, who created the Average Directional Index (ADX). The Vortex Indicator focuses on the relationship between the highs and lows of prices to determine the strength and direction of a market trend.
$9.90
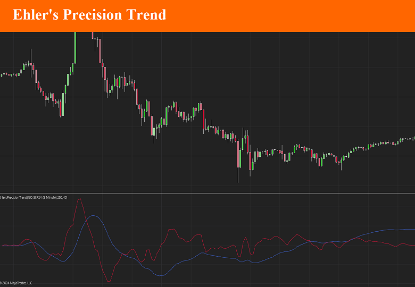
Ehler's Precision Trend
Ehler's Precision Trend Indicator (EPTI), developed by John Ehlers, is a technical analysis tool designed to identify market trends with high accuracy and minimal lag. John Ehlers is known for his work on applying digital signal processing techniques to technical analysis, and the Precision Trend Indicator is one of his innovative contributions aimed at improving the detection of price trends in financial markets.
$9.90
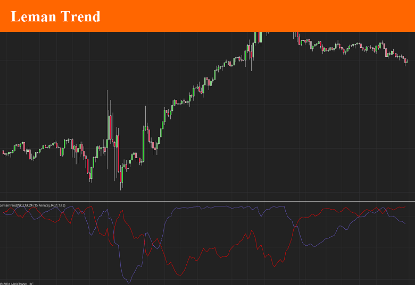
Leman
The LeMan Trend Indicator is a trend-following tool commonly used in trading platforms like MetaTrader 4 (MT4), MetaTrader 5 (MT5), and TradingView. This is why we developed it for the Ninjatyrader 8 platform. It is designed to help traders identify market trends by generating buy and sell signals based on price movements. This indicator works best as a support tool to other main indicators, serving as a signal filter to refine entry and exit points.
$9.90
