Cookies help us deliver our services. By using our services, you agree to our use of cookies.
You have no items in your shopping cart.
Filter by price
Products tagged with 'confirmation indicator'
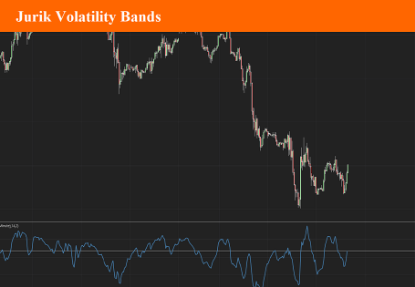
Jurik Volatility Bands
Volatility is a core concept in trading and impacts our trading strategies. Therefore, all traders should have some sort of volatility indicator displayed to gauge the current volatility and future expected moves. Jurik Volatility Bands displays the price inside a volatility channel. In this way, we can measure the current price action in accordance with its volatility.
$9.90
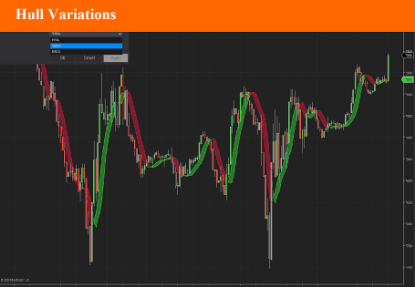
Hull Variations
This indicator include three variations of the basic Hull Moving average: - The Hull Moving average itselve - The Exponential Hull Moving average - The Triple Hull Moving average You can use theses differents types of moving averages as baseline, or confirmation indicator. It work on all assets and all timeframes.
$9.90
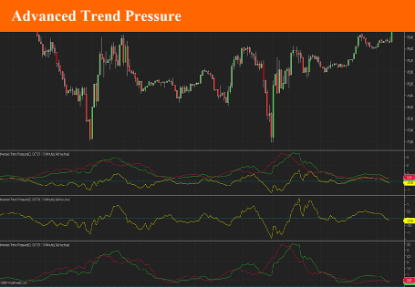
Advanced Trend Pressure
The Advance Trend Pressure indicator shows the trend direction and strength line. It can additionally show the bullish and bearish components of the trend. Trend is determined using Close-Open, High-Close and Open-Close price (for a bearish candlestick) and Open-Close, High-Open and Close-Low prices (for a bearish candlestick) - i.e. the indicator uses the size and direction of candlestick bodies and the size of their shadows. It has three parameters: Period - indicator calculation period; Show lines Up and Down - showing the lines of the bullish and bearish components. Alert - used to display alerts when bullish and bearish lines crosses
$9.90
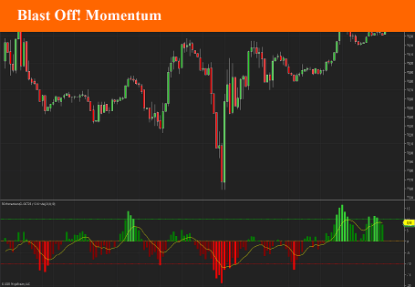
Blast Off! Momentum
This indicator is an alternative interpretation of the Blast Off Indicator by Larry Williams. This formula takes positive and negative magnitudes rather than the absolute value. The result is then smoothed with an EMA, and twice smoothed to provide a signal line. Originaly found on tradingview: https://www.tradingview.com/script/fhjAA1Dq-Blast-Off-Momentum-DW/
$9.90
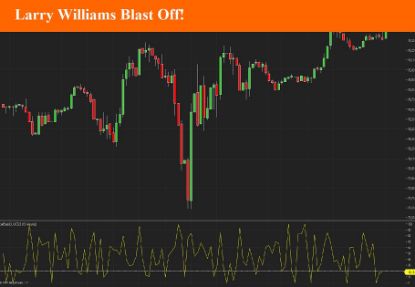
Larry Williams Blast Off!
Indicator designed by Larry Williams, who in 2002 called this indicator Blast Off, which translated means to jump out. The indicator aims to identify price explosions, both positive and negative. To obtain this result the OPEN and CLOSE values are compared with HIGH and LOW and if the difference between the OPEN and the CLOSE of the day is less than 20% of the range (HIGH-LOW), the explosion is likely to occur of price, or if the absolute value of (OPEN-CLOSE) / HIGH-LOW is less than 20% a Blast Off is expected This indicator doesn't work on renko bars, or bars where high-low equals open-close.
$9.90
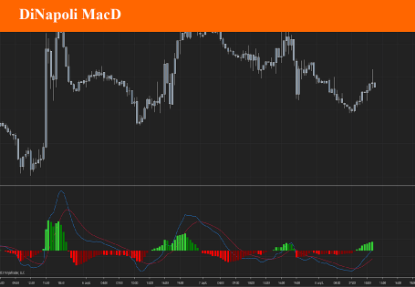
DiNapoli MacD (DEMA)
Dinapoli MacD is a trending indicator that give you not only what direction a market is moving but also how volatile the price is. When the market starts giving new max or minimum level values, the Dinapoli macd follows the price trend direction and pulls up the level of quit from the currency market . Stops should be applied where they are for a purpose, and in that case, should not be changed. The whole idea behind a practical trading plan is to keep it as simple as possible. There are two main advantages to its use. 1. You are able to determine, one period ahead of time, what price will cause theMACD to turn from a buy to a sell or visa versa. It is a cousin to the Oscillator predictor. If you take a position you know right then and there, the exact price, the current and next (future) bar will need to achieve for the MACD to cross. You can also literally see the distance the market has to go, before your current position is either helped or hindered by the force of the next MACD cross. You can do this in all time frames, as the indicator updates in real time. 2. You are able to determine the “Dynamic Pressure” on the market by clearly observing price action with the MACD history. Dynamic pressure refers to how the market reacts to buy and sell signals. If you get a 30 minute sell on the MACD and the market goes flat for example, you know right then and there that the next buy signal is apt to be a big winner! This was something I would regularly do with the standard DiNapoli MACD but now it is so much easier to see!
$9.90
