Cookies help us deliver our services. By using our services, you agree to our use of cookies.
You have no items in your shopping cart.
Filter by price
Products tagged with 'confirmation indicator'
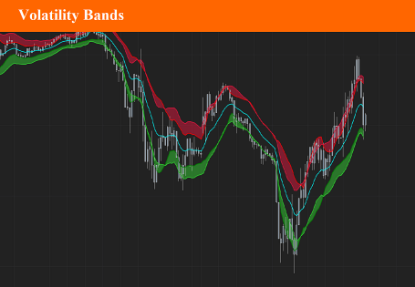
Volatility Bands
The Volatility Bands indicator, attempts to present a way to measure and visualize volatility, using standard deviations (σ) and average true range indicator, and aims to point out areas that might indicate potential trading opportunities. Volatility Bands indicator combines the approach of both Bollinger Bands and Keltner Channel, with different settings and different visualization
$9.90
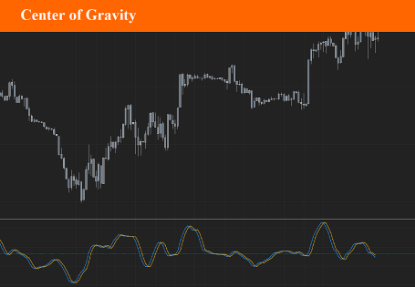
Center of Gravity
The Stochastic Center Of Gravity Indicator was created by John Ehlers (Stocks and Commodities Magazine) It provides a pretty accurate way to see how the stock is trending. If the indicator stays above 0 then the stock is in a pretty strong uptrend and if it stays below 0 then the stock is in a pretty strong downtrend. Buy when the indicator changes crosses 0 upward and sell when it crosses downward.
$9.90
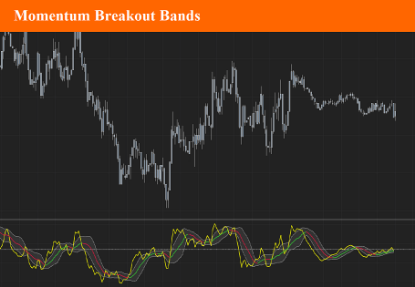
Momentum Breakout Bands
These bands are bollinger bands that have an adjusted standard deviation. There are Buy signals when it has momentum breakouts above the bands for moves to the upside and Sell signals when it has momentum breakouts below the bands for moves to the downside. The bands simply suggest that all markets have periods of chop which we all know to be true. While the price is inside the bands it is said to be trendless. Once the breakouts happen you can take trades in the breakout direction. The bands should work on most instruments and timeframes
$9.90
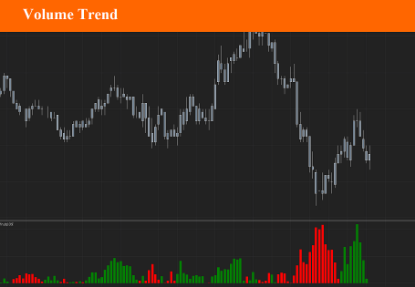
Volume Trend
Volume Trend is a variation of standard Volume Up/Down indicator. Its originality is to apply Simple moving average on volume, and display the difference between Up and Down volume on an histogram. It is a very usefull way to view the change and spike in volume very quickly. This is a great indicator for scalpers.
$9.90
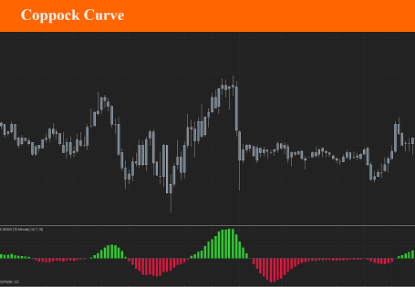
Coppock Curve
The Coppock Curve indicator was developed by an economist named Edwin Coppock in 1962 and was first introduced in that year’s October issue of Barron’s Magazine. It was initially developed for long term monthly charts, shorter timeframes resulted in more frequent signals.
$9.90
Source code
Do you know you can ask us for any product source code ? If you want/need any NinjaScript source code you can simply buy this product and ask us via the Contact Us page. We will then deliver the source for any single product. This is available for all the content of this web site.
$99.00
