Cookies help us deliver our services. By using our services, you agree to our use of cookies.
You have no items in your shopping cart.
Filter by price
Products tagged with 'confirmation indicator'
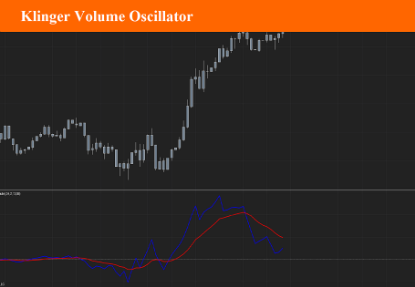
Klinger Volume Oscillator
The Klinger Volume Oscillator (KVO, also named Klinger Oscillator) was developed by Stephen J. Klinger . Learning from prior research on volume by such well-known technicians as Joseph Granville, Larry Williams , and Marc Chaikin, Mr. Klinger set out to develop a volume-based indicator to help in both short- and long-term analysis.
$9.90
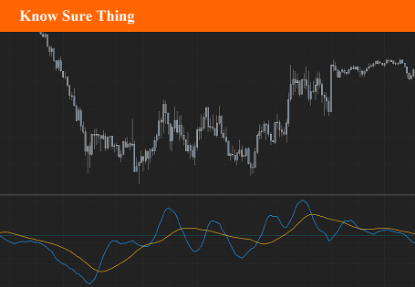
Know Sure Thing
The Know Sure Thing (KST) is a momentum oscillator developed by Martin Pring to make rate-of-change readings easier for traders to interpret.
$9.90
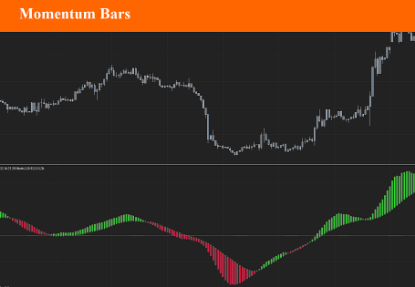
Momentum Bars
Momentum Bars offers a different way to visualize momentum - and uses some simple TA concepts to provide a different perspective into how we read momentum changes and incorporate that in our trading. The idea here (and the script itself) is really super simple, and is inspired by Elder's Impulse System ( EIS ) - then evolved to leverage some other concepts, and to become less cluttering and "easier to read".
$9.90
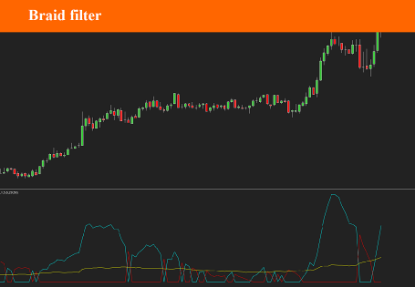
Braid Filter (v1)
The Braid Filter Indicator was first introduced in 2006 by a man named Robert Hill, also known as “Mr.Pips” in Stocks and Commodities Magazine. By the way, Mr. Hill created the first version of this indicator. Over the years, coders created subsequent versions and added modifications. The “braid” is formed by line intersections based on various types of moving averages.
$9.90
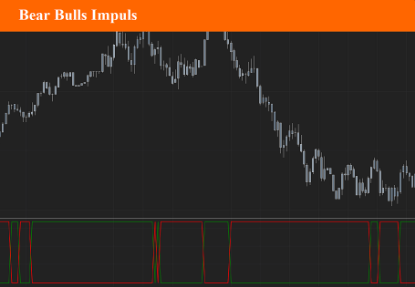
Bears Bulls Impulse
This indicator is an adaptation of the Elder Ray Index indicator developed by Dr. Alexander Elder. The original version was developed in 1989 and was given the name Elder “Ray” because he felt it could see through the market, just as an X-Ray can see your bones through your skin.
$9.90
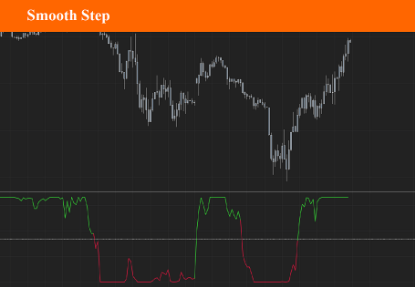
Smooth Step
This indicator was adopted from work done by a very smart guy named Kenneth H. Perlin, who is a professor at New York University in the Computer Science Department. His work centered around something called “Sigmoid Function” having a characteristic “S”-shaped curve or sigmoid curve
$9.90
