Cookies help us deliver our services. By using our services, you agree to our use of cookies.
You have no items in your shopping cart.
Filter by price
Filter by manufacturer
Volume Indicators
In trading, volume refers to the number of trades executed within a particular time frame. It’s a direct indication of the asset’s supply and demand.
By measuring the volume of trading, volume indicators indicate whether a trend is likely to last.
For example, high volume on the uptrend indicates high demand and therefore, a further price increase. It works the same way in the reversed scenario: high volume on the downtrend indicates high supply and a likelihood of a further price drop.
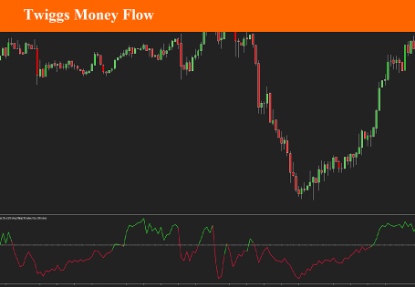
Twiggs Money Flow
Twiggs Money Flow is Colin Twiggs' derivation of the popular Chaikin Money Flow indicator, which is in turn derived from the Accumulation Distribution line. While Chaikin Money Flow uses Close Location Value to evaluate volume as bullish or as bearish, Twiggs Money Flow, uses the True Range. Twiggs Money Flow also relies on moving averages in its calculation while Chaikin uses cumulative volume.
$9.90
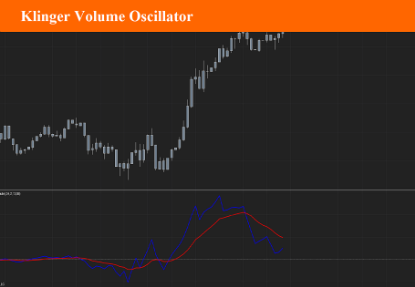
Klinger Volume Oscillator
The Klinger Volume Oscillator (KVO, also named Klinger Oscillator) was developed by Stephen J. Klinger . Learning from prior research on volume by such well-known technicians as Joseph Granville, Larry Williams , and Marc Chaikin, Mr. Klinger set out to develop a volume-based indicator to help in both short- and long-term analysis.
$9.90
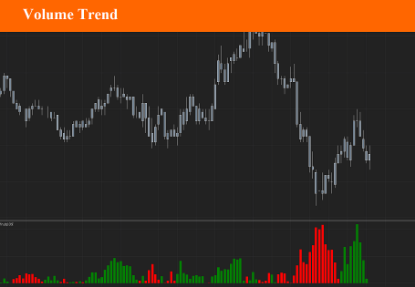
Volume Trend
Volume Trend is a variation of standard Volume Up/Down indicator. Its originality is to apply Simple moving average on volume, and display the difference between Up and Down volume on an histogram. It is a very usefull way to view the change and spike in volume very quickly. This is a great indicator for scalpers.
$9.90
Trend Direction and Force Index
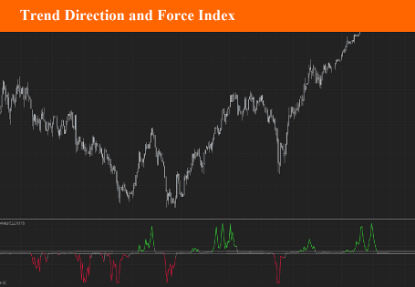
Developed by psychologist and trader Alexander Elder, it was first published in his 1993 book, “Trading for a Living”. This indicator is an oscillator that swings between 1 and -1 and can be qualified as a zero cross by combining both price movement and volume. It has the added advantage of displaying a neutral zone where no significant bull or bear “force” exists, and the market has no distinct direction. This area is between -0.05 and +0.05 as noted on the indicator levels.
$9.90
Volume Flow Indicator
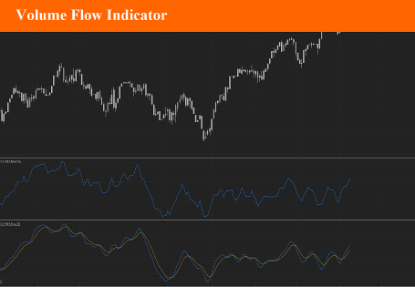
VFI,introduced by Markos Katsanos, is based on the popular On Balance Volume (OBV) but with three very important modifications: * Unlike the OBV, indicator values are no longer meaningless. Positive readings are bullish and negative bearish. * The calculation is based on the day's median (typical price) instead of the closing price. * A volatility threshold takes into account minimal price changes and another threshold eliminates excessive volume. A simplified interpretation of the VFI is: * Values above zero indicate a bullish state and the crossing of the zero line is the trigger or buy signal. * The strongest signal with all money flow indicators is of course divergence.
$9.90
Volume Moving Average
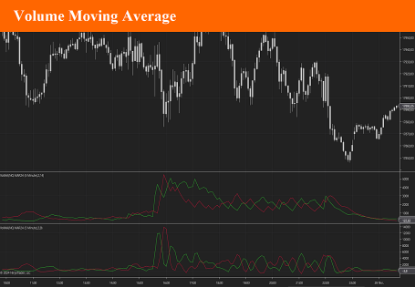
Volume moving average is an indicator based on Ninjatrader Volume Up & Down. It applies a choice of 10 differents moving averages (DEMA, EMA, HMA, LinReg, SMA, TMA, TEMA, VWMA, ZLEMA and WMA). The result is displayed as an "oscillator like" indicator. Buy and sell signals are given in many different ways, so it's up to you to choose the one that suits you best.
$9.90
- 1
- 2
