Cookies help us deliver our services. By using our services, you agree to our use of cookies.
You have no items in your shopping cart.
Filter by price
Products tagged with 'trend'
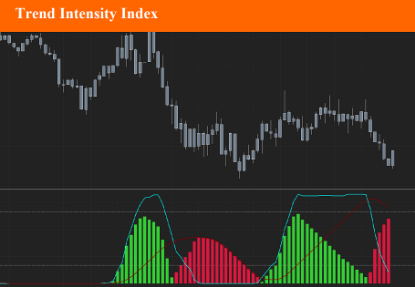
Trend Intensity Index
The Trend Intensity Index (TTI) indicator can help determine the strength of the current market trend. The TII range is between 0 and 100, where typically a value above 50 is a bullish trend, and a value below 50 is a bearish trend.
$9.90
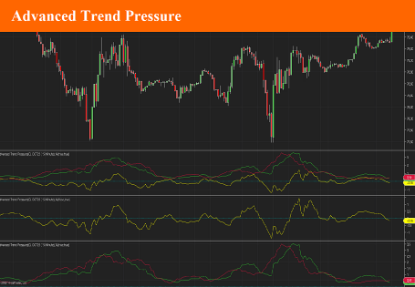
Advanced Trend Pressure
The Advance Trend Pressure indicator shows the trend direction and strength line. It can additionally show the bullish and bearish components of the trend. Trend is determined using Close-Open, High-Close and Open-Close price (for a bearish candlestick) and Open-Close, High-Open and Close-Low prices (for a bearish candlestick) - i.e. the indicator uses the size and direction of candlestick bodies and the size of their shadows. It has three parameters: Period - indicator calculation period; Show lines Up and Down - showing the lines of the bullish and bearish components. Alert - used to display alerts when bullish and bearish lines crosses
$9.90
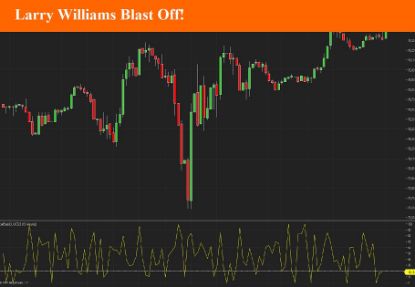
Larry Williams Blast Off!
Indicator designed by Larry Williams, who in 2002 called this indicator Blast Off, which translated means to jump out. The indicator aims to identify price explosions, both positive and negative. To obtain this result the OPEN and CLOSE values are compared with HIGH and LOW and if the difference between the OPEN and the CLOSE of the day is less than 20% of the range (HIGH-LOW), the explosion is likely to occur of price, or if the absolute value of (OPEN-CLOSE) / HIGH-LOW is less than 20% a Blast Off is expected This indicator doesn't work on renko bars, or bars where high-low equals open-close.
$9.90
Geometric Mean Moving Average
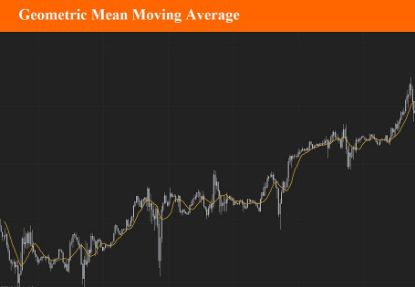
The Geometric moving average calculates the geometric mean of the previous N bars of a time series. The simple moving average uses the arithmetic mean, which means that it is calculated by adding the time series' value of the N previous bars and then dividing the result with the lookback period. The geometric mean on the other hand is calculated by multiplying the time series' N previous values (multiplication is used instead of the addition) and then taking the N'th root product of the last result.
$9.90
Glitch Index
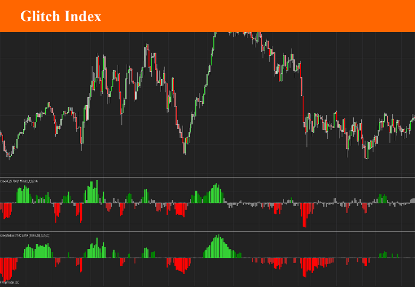
The Glitch Indicator, commonly referred to as the Glitch Index, is an oscillator used in technical analysis for trading. It was discovered in 2013 and is known for its ability to identify market trends, their strength, and potential reversals. Here are the key features and uses: Market Trend Identification: The Glitch Index helps traders determine the current market trend, providing insights into whether the market is bullish or bearish. Trend Strength and Reversals: It assesses the strength of a trend and indicates potential points where the trend might reverse . Trend Filtering: The indicator includes a trend filter to screen out false signals, improving the reliability of the trends it identifies
$9.90
Double Donchian
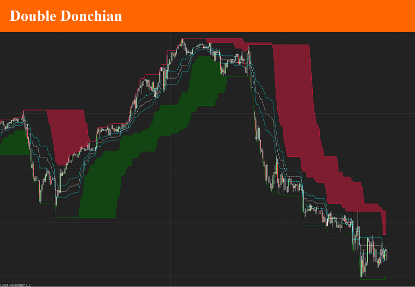
The double donchian indicator is the association between two donchian channel, each with different period parameter. Using the fast and slow Donchian channels you'll be able to get long and short trading signals. When the price crosses the slow channel, open long or short positions. When the price crosses the fast channel again, close the positions. You may also use it as a trend indicator by checking the differences between channel 1 low and channel 2 low values and channel 1 and channel 2 high value. A set of 3 Fibonacci lines will complete this indicator.
$9.90
- 1
- 2
