Cookies help us deliver our services. By using our services, you agree to our use of cookies.
You have no items in your shopping cart.
Filter by price
Products tagged with 'line cross'
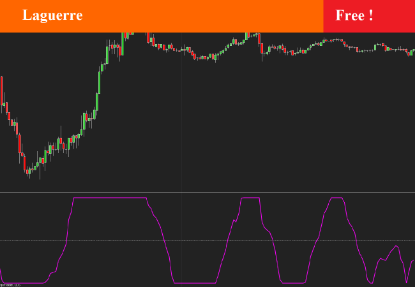
Laguerre
Laguerre RSI is based on John EHLERS' Laguerre Filter to avoid the noise of RSI . As such, it is possible to use it to plot trend changes more precisely - and thus open and close positions at these points.
$0.00
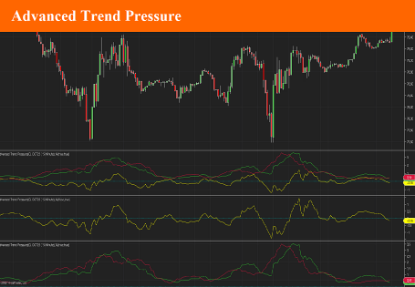
Advanced Trend Pressure
The Advance Trend Pressure indicator shows the trend direction and strength line. It can additionally show the bullish and bearish components of the trend. Trend is determined using Close-Open, High-Close and Open-Close price (for a bearish candlestick) and Open-Close, High-Open and Close-Low prices (for a bearish candlestick) - i.e. the indicator uses the size and direction of candlestick bodies and the size of their shadows. It has three parameters: Period - indicator calculation period; Show lines Up and Down - showing the lines of the bullish and bearish components. Alert - used to display alerts when bullish and bearish lines crosses
$9.90
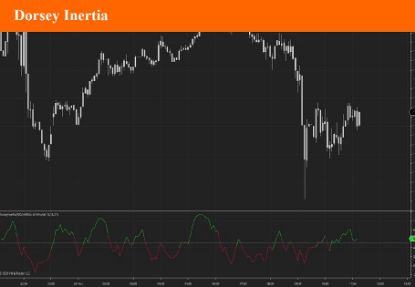
Dorsey Inertia
Developed by Donald Dorsey, the Inertia Indicator is an extension of Dorseys Relative Volatility Index and is used to define the long-term trend and how far it has extended. Its name refers to the physics term and its reference to direction and mass of motion. Dorsey states that a trend is simply the “outward result of inertia” and as such, the market will require much more energy to reverse its direction than to extend the ongoing move.
$9.90
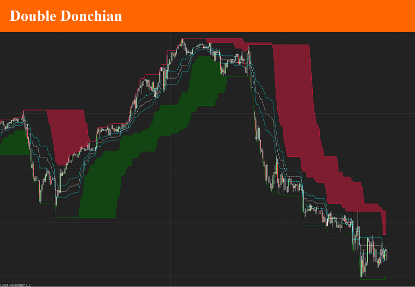
Double Donchian
The double donchian indicator is the association between two donchian channel, each with different period parameter. Using the fast and slow Donchian channels you'll be able to get long and short trading signals. When the price crosses the slow channel, open long or short positions. When the price crosses the fast channel again, close the positions. You may also use it as a trend indicator by checking the differences between channel 1 low and channel 2 low values and channel 1 and channel 2 high value. A set of 3 Fibonacci lines will complete this indicator.
$9.90
