Cookies help us deliver our services. By using our services, you agree to our use of cookies.
You have no items in your shopping cart.
Filter by price
nt8indicators
nt8indicator is a software editor dedicated to the trading world, and more specifically to NinjaTrader 8.x
Our goal is to provide you with efficient, inexpensive and easy to use indicators.
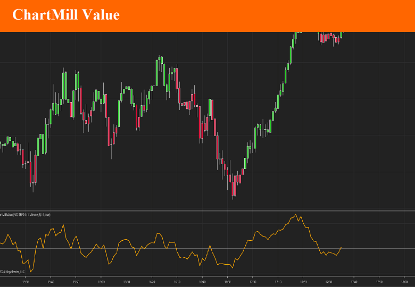
ChartMill Value
Developed by Dirk Vandycke, ChartMill Value indicator tracks how far the price spread is from its moving average. Since MA keeps increasing even when price consolidates or stalls, it is very difficult for the deviation from a moving average to remain in the overbought or oversold regions for extended periods, which represents a significant improvement over other oscillators such as the RSI and Stochastic indicators.
This indicator is best used with other oscillators, to confirm signals. Zero line crossovers should also be considered as signals.
This indicator will be able to colorize candles according to its trend (> 0 = up trend, < 0 down trend) and send alert when the zeroline is crossed.
$9.90
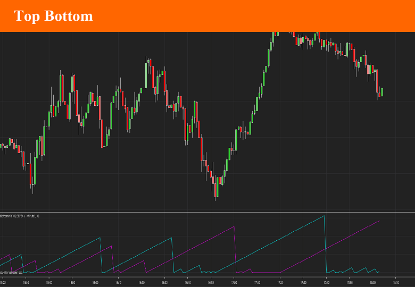
Top Bottom
This indicator is a two line cross indicator. It searches for a specific occurrence where the current high price is larger than the last high price and is also larger than the high price a specified number of periods in the past. The same goes for the low.
It looks similar to the Aroon indicator but doesn't work the same way. They may be both used in conjunction.
Buy and Sell signal are given by the crossing of the Longsignal and ShortSignal Lines.
With this indicator you will be able to colorize canbdles according to the trend.
You may also receive alerts when the shjort and long lines are crossing.
$9.90
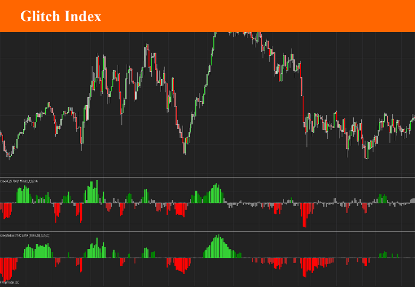
Glitch Index
The Glitch Indicator, commonly referred to as the Glitch Index, is an oscillator used in technical analysis for trading. It was discovered in 2013 and is known for its ability to identify market trends, their strength, and potential reversals. Here are the key features and uses:
Market Trend Identification: The Glitch Index helps traders determine the current market trend, providing insights into whether the market is bullish or bearish.
Trend Strength and Reversals: It assesses the strength of a trend and indicates potential points where the trend might reverse .
Trend Filtering: The indicator includes a trend filter to screen out false signals, improving the reliability of the trends it identifies
$9.90
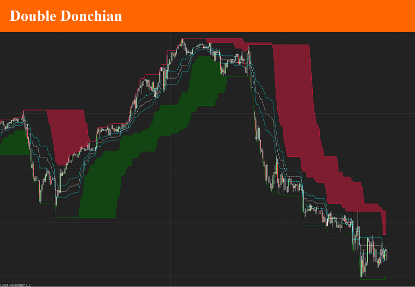
Double Donchian
The double donchian indicator is the association between two donchian channel, each with different period parameter.
Using the fast and slow Donchian channels you'll be able to get long and short trading signals. When the price crosses the slow channel, open long or short positions. When the price crosses the fast channel again, close the positions.
You may also use it as a trend indicator by checking the differences between channel 1 low and channel 2 low values and channel 1 and channel 2 high value.
A set of 3 Fibonacci lines will complete this indicator.
$9.90
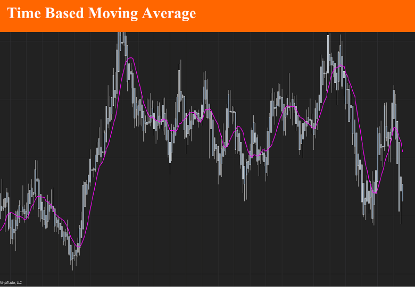
Time based moving average
A time-based moving average is a technique used to calculate the average of data points over a specific period. Unlike traditional moving averages that use a fixed number of samples, a time-based moving average adjusts based on the actual time that has passed. This method is useful in scenarios where data sampling intervals are irregular or where the importance lies in the time duration rather than the count of samples. This is mostly the case in non-time based timeframe such as Renko.
$9.90
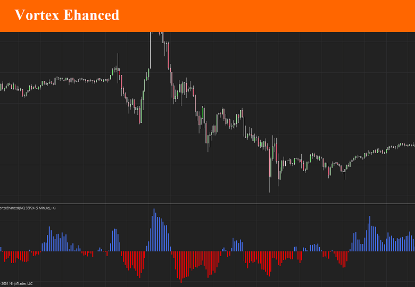
Vortex Ehanced
The Vortex Indicator is a technical analysis tool used in financial markets to identify the start of a new trend or the continuation of an existing trend. It was developed by Etienne Botes and Douglas Siepman in 2010 and is based on the work of J. Welles Wilder, who created the Average Directional Index (ADX). The Vortex Indicator focuses on the relationship between the highs and lows of prices to determine the strength and direction of a market trend.
$9.90
