Cookies help us deliver our services. By using our services, you agree to our use of cookies.
You have no items in your shopping cart.
Filter by price
nt8indicators
nt8indicator is a software editor dedicated to the trading world, and more specifically to NinjaTrader 8.x
Our goal is to provide you with efficient, inexpensive and easy to use indicators.
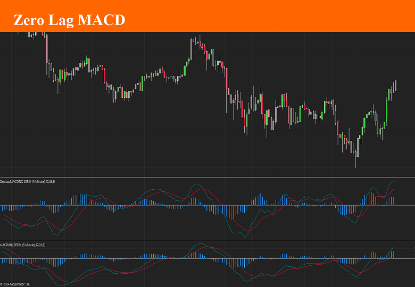
Zero Lag MACD
The Zero Lag MACD (Moving Average Convergence Divergence) is a variation of the traditional MACD indicator, designed to reduce the inherent lag in the original MACD, providing traders with faster and more responsive signals. By doing so, it aims to give earlier warnings of potential trend changes or reversals.
$9.90
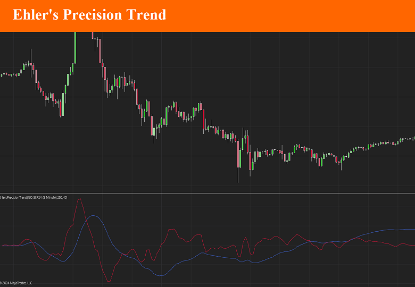
Ehler's Precision Trend
Ehler's Precision Trend Indicator (EPTI), developed by John Ehlers, is a technical analysis tool designed to identify market trends with high accuracy and minimal lag. John Ehlers is known for his work on applying digital signal processing techniques to technical analysis, and the Precision Trend Indicator is one of his innovative contributions aimed at improving the detection of price trends in financial markets.
$9.90
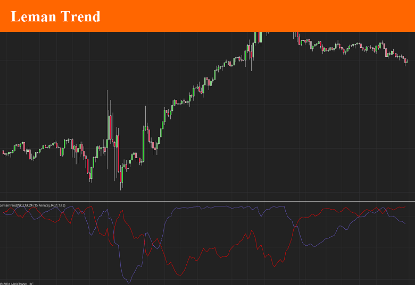
Leman
The LeMan Trend Indicator is a trend-following tool commonly used in trading platforms like MetaTrader 4 (MT4), MetaTrader 5 (MT5), and TradingView. This is why we developed it for the Ninjatyrader 8 platform. It is designed to help traders identify market trends by generating buy and sell signals based on price movements. This indicator works best as a support tool to other main indicators, serving as a signal filter to refine entry and exit points.
$9.90
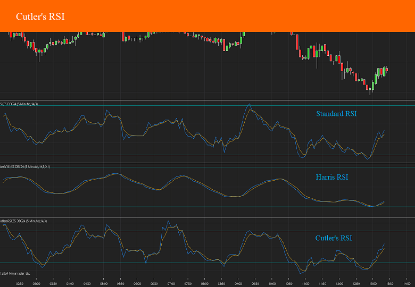
Cutler's RSI
Cutlers RSI is a simple moving average based version of the popular Relative Strength Index momentum oscillator which was developed by J. Welles Wilder and detailed in his book New Concepts in Technical Trading Systems. It analyses Average Gains and Average Losses to measure the speed and magnitude of price movements. The RSI is always between 0 and 100, with stocks above 70 considered overbought and stocks below 30 oversold. Divergence between the price and RSI can also be analysed for potential reversals. Average Gain is calculated as an SMA of the gains in the Period. The Average Loss is similarly calculated using Losses.
$9.90
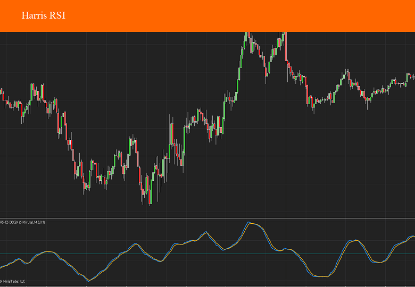
Harris RSI
Harris RSI is a variation of the standard Relative Strength Index (RSI) used in technical analysis. This indicator follows similar principles to the classic RSI by indicating overbought or oversold conditions in an asset, helping traders assess momentum and trend changes. However, specific features distinguish it: Trend OB/OS: It signals an uptrend when above the overbought level and a downtrend when below the oversold level. Overbought/Oversold Indicator: Values above a certain threshold (overbought) or below a certain threshold (oversold) indicate potential price reversals. 50-Cross Signal: Crossing above the 50 line suggests bullish momentum, while a drop below indicates bearish momentum[1]. This variant provides an additional layer of nuance for trend analysis, focusing on trend strength as well as reversal points.
$9.90
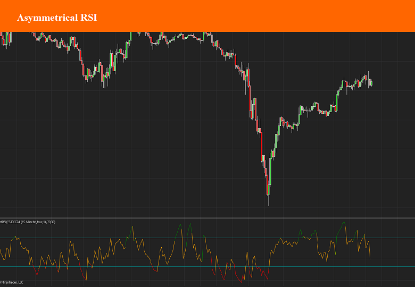
Asymmetrical RSI
ARSI, or the Asymmetrical Relative Strength Index, is a technical indicator that builds upon the traditional Relative Strength Index (RSI) by focusing on smoothing out market noise to identify trends more clearly. It was developed by Sylvain Vervoort to address some limitations of the standard RSI by using asymmetrical adjustments. This adaptation aims to provide clearer signals for entry and exit points in trading by making trend direction and strength more evident in volatile markets. The ARSI modifies the original RSI calculation by using a moving average and standard deviation to help filter out noise, improving the accuracy of identifying significant market moves. This can help traders respond earlier to market changes, with ARSI designed particularly for detecting both bullish and bearish momentum shifts more effectively
$9.90
