Cookies help us deliver our services. By using our services, you agree to our use of cookies.
You have no items in your shopping cart.
Welcome to nt8indicators.com !
Our goal is to allow you to discover original, effective and accessible indicators and tools available on the NinjaTrader 8.x platform.
Our policy of low prices should make these components accessible to all. Each one is accompanied by a complete documentation allowing a fast and effective handling.
We hope to make this experience rich and satisfying for you.
We work in collaboration with NinjaTrader and you can find our tools on the NinjaTrader EcoSystem platform.
We strongly recommend APEX as a first class Prop firm:
Featured products
Larry Williams Proxy Index
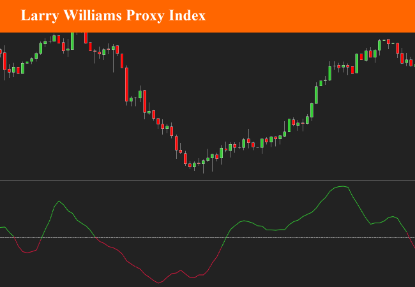
Larry Williams Proxy Index (LWPI), sometimes just called one the Larry Williams Indicators is a confirmation indicator. First and foremost, Larry Williams has been revered as one of the founding father’s of modern trading, his career spanning over 40 years. He has published multiple books on trading, and his material featured in various trading magazine.
$9.90
Telegram Share Service
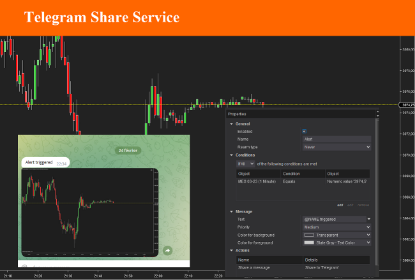
Telegram ShareService is the easiest way for you to receive alarms or notifications from Ninjatrader on your Telegram Group, on Mobile or Desktop.
The Telegram ShareService for Ninjatrader 8 was developed for several purposes, but mainly for those who are willing to setup signal groups.
With Telegram Share service, you can easily share indicators alerts, orders alert (open, close, TP/SL), or NinjaTrader alerts. It is highly integrable inside your strategies.
$19.90
Larry Williams Large Trade Index
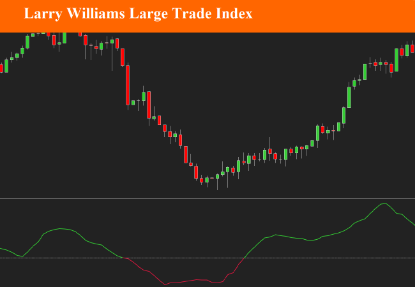
Larry Williams Large Trade Index (LWTI) is an indicatory by Larry Williams as explained in his book "Trade Stocks and Commodities with the Insiders: Secrets of the COT Report".
The original concept was specifically based on Trader (or Market) Sentiment and predicting market reversals.
$9.90
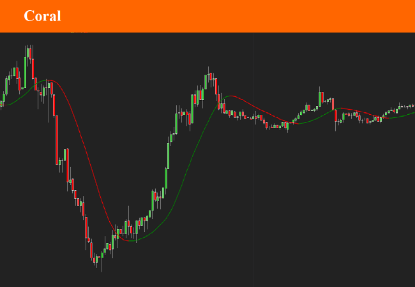
Coral
This indicator is considered a “confirmation indicator” which falls into the category of indicators that serve as an initial checkpoint after the baseline indicator provides you with a foundational signal.
The Coral indicator is a combination of moving averages smoothed exponentially.
$9.90
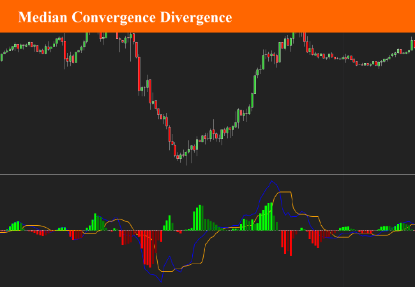
Median Convergence Divergence
The Median Convergence Divergence ( MCD ) is a derivative of the Moving Average Convergence Divergence ( MACD ). The difference is the change in the use of the measure of central tendency. In MACD , moving average (mean) is used, whereas, in MCD , the median is used instead. The purpose of using the median is to eliminate the outlying values, which would be calculated for a moving average. The outliers would affect the value of the moving average.
$9.90
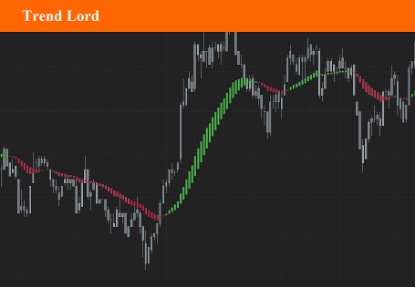
Trend Lord
The TrendLord indicator is a chart overlay indicator which can be used as a confirmation indicator. It is a derivative of a smoothed moving average but with the advantage of representing it as a colored change histogram.
$9.90
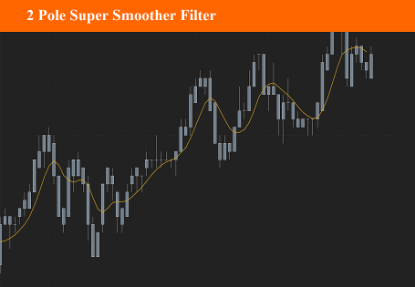
2 Pole Super Smoother Filter
The Two Pole Super Smooth Filter indicator is a moving average type trading indicator with smoothing filter. It was created by John Ehlers (Cybernetic Analysis For Stocks And Futures pg 202) and is one of his filters that follows the price very closely.
$9.90
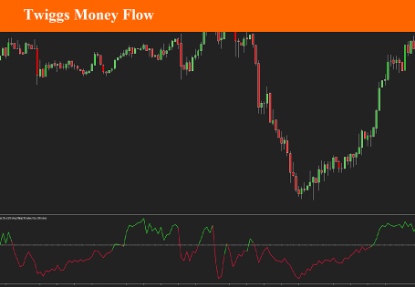
Twiggs Money Flow
Twiggs Money Flow is Colin Twiggs' derivation of the popular Chaikin Money Flow indicator, which is in turn derived from the Accumulation Distribution line.
While Chaikin Money Flow uses Close Location Value to evaluate volume as bullish or as bearish, Twiggs Money Flow, uses the True Range. Twiggs Money Flow also relies on moving averages in its calculation while Chaikin uses cumulative volume.
$9.90
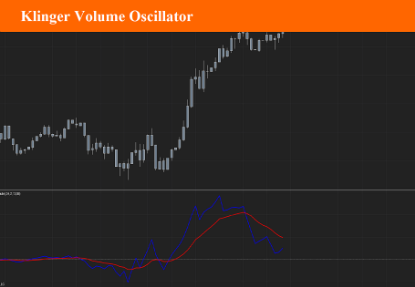
Klinger Volume Oscillator
The Klinger Volume Oscillator (KVO, also named Klinger Oscillator) was developed by Stephen J. Klinger . Learning from prior research on volume by such well-known technicians as Joseph Granville, Larry Williams , and Marc Chaikin, Mr. Klinger set out to develop a volume-based indicator to help in both short- and long-term analysis.
$9.90
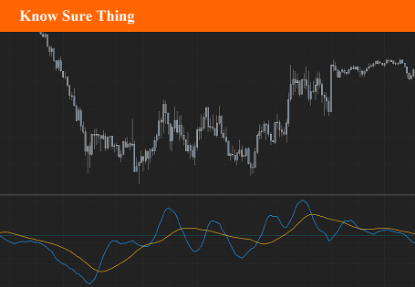
Know Sure Thing
The Know Sure Thing (KST) is a momentum oscillator developed by Martin Pring to make rate-of-change readings easier for traders to interpret.
$9.90
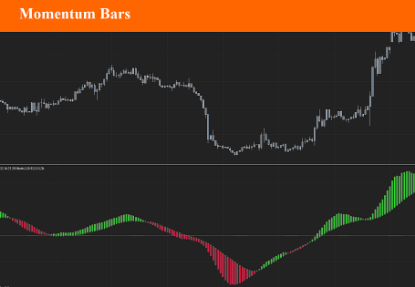
Momentum Bars
Momentum Bars offers a different way to visualize momentum - and uses some simple TA concepts to provide a different perspective into how we read momentum changes and incorporate that in our trading.
The idea here (and the script itself) is really super simple, and is inspired by Elder's Impulse System ( EIS ) - then evolved to leverage some other concepts, and to become less cluttering and "easier to read".
$9.90
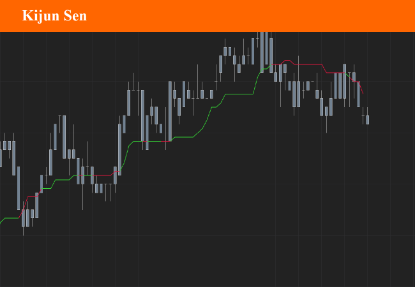
Kijun Sen
Kijun Sen is one of the most important lines of the ichimoku kinko hyo.
Kijun Sen represents the average point of the last 26 periods. It is the average of the highest and lowest of the last 26 periods (last 26 candlesticks).
The Kijun Sen forms steps. These landings are commonly called "Kijun flats". Kijun flats are important levels of support or resistance.
Kijun Sen flats represent the 50% retracement level. Kijun Sen flat is equal to the 50% Fibonacci retracement level.
In a trend phase (not in a range period) it is often relevant to consider buying or selling during pullbacks on the Kijun Sen.
$4.90
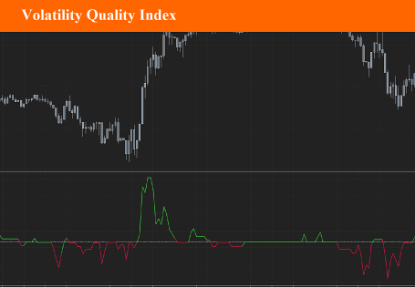
Volatility Quality Index
Volatility Quality Indicator (VQI) is a technical indicator that was developed to identify quality stocks with low volatility. The indicator is based on the assumption that assets with low volatility are less risky and more stable.
The original concept by Thomas Stridsman was first published in 2002 and can be found in the Technical Analysis section of Stocks and Commodities magazine.
$9.90
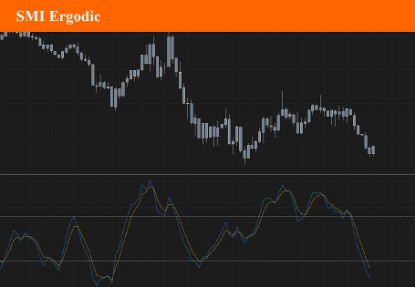
SMI Ergodic
The Stochastic Momentum Index (SMI) Ergodic is a leading indicator that sends buy and sell signals by predicting an upcoming reversal in the price of an asset. Trending markets are the easiest markets to make a profit in because the direction of the trend is predictable and we can place trades as long as the trend lasts.
$9.90
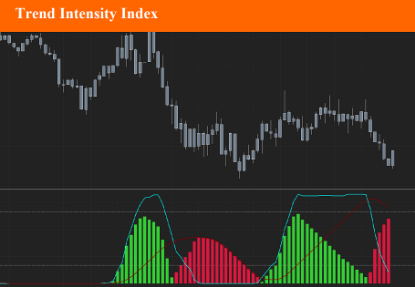
Trend Intensity Index
The Trend Intensity Index (TTI) indicator can help determine the strength of the current market trend. The TII range is between 0 and 100, where typically a value above 50 is a bullish trend, and a value below 50 is a bearish trend.
$9.90
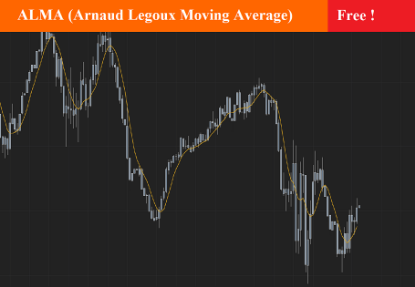
Arnaud Legoux Moving Average
As the name suggests, the ALMA indicator is a moving average (MA) variant and was created by Arnaud Legoux in 2009. The goal was to decrease the lag commonly encountered with moving averages.
As with most moving averages, this indicator aims to detect trends and trend reversals. It works similarly to other moving averages, but one of the main differentiators is that it calculates 2 moving averages, one from left to right and one from right to left. This output is then further processed through a customizable formula, for either increased smoothness or increased responsiveness.
$0.00
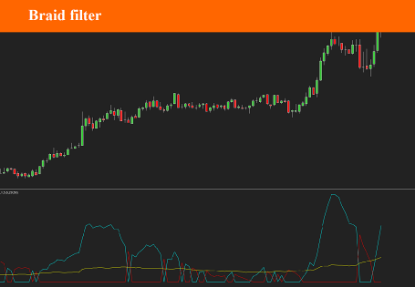
Braid Filter (v1)
The Braid Filter Indicator was first introduced in 2006 by a man named Robert Hill, also known as “Mr.Pips” in Stocks and Commodities Magazine. By the way, Mr. Hill created the first version of this indicator. Over the years, coders created subsequent versions and added modifications. The “braid” is formed by line intersections based on various types of moving averages.
$9.90
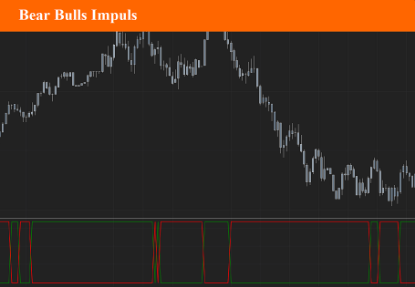
Bears Bulls Impulse
This indicator is an adaptation of the Elder Ray Index indicator developed by Dr. Alexander Elder. The original version was developed in 1989 and was given the name Elder “Ray” because he felt it could see through the market, just as an X-Ray can see your bones through your skin.
$9.90
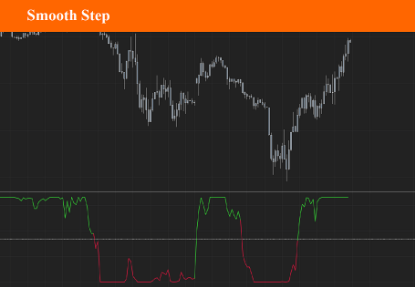
Smooth Step
This indicator was adopted from work done by a very smart guy named Kenneth H. Perlin, who is a professor at New York University in the Computer Science Department. His work centered around something called “Sigmoid Function” having a characteristic “S”-shaped curve or sigmoid curve
$9.90
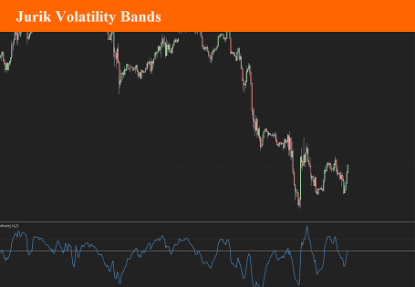
Jurik Volatility Bands
Volatility is a core concept in trading and impacts our trading strategies. Therefore, all traders should have some sort of volatility indicator displayed to gauge the current volatility and future expected moves.
Jurik Volatility Bands displays the price inside a volatility channel. In this way, we can measure the current price action in accordance with its volatility.
$9.90
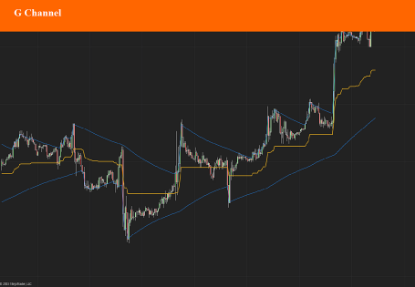
GChannel
This version of the GChannel indicator was created in 2021 by a gifted coder. It’s pretty easy to use and provides clear signals,
It may be used as a baseline indicator.
$9.90
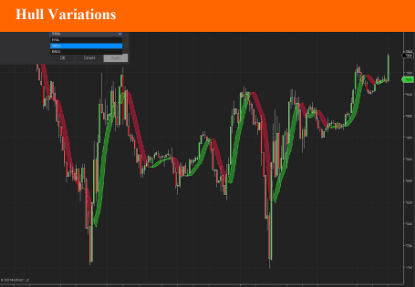
Hull Variations
This indicator include three variations of the basic Hull Moving average:
- The Hull Moving average itselve
- The Exponential Hull Moving average
- The Triple Hull Moving average
You can use theses differents types of moving averages as baseline, or confirmation indicator. It work on all assets and all timeframes.
$9.90
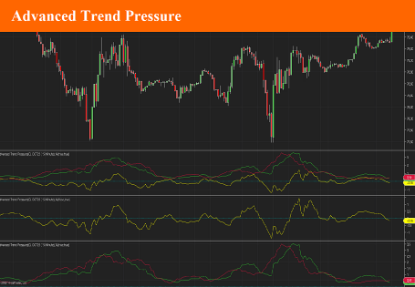
Advanced Trend Pressure
The Advance Trend Pressure indicator shows the trend direction and strength line. It can additionally show the bullish and bearish components of the trend.
Trend is determined using Close-Open, High-Close and Open-Close price (for a bearish candlestick) and Open-Close, High-Open and Close-Low prices (for a bearish candlestick) - i.e. the indicator uses the size and direction of candlestick bodies and the size of their shadows.
It has three parameters:
Period - indicator calculation period;
Show lines Up and Down - showing the lines of the bullish and bearish components.
Alert - used to display alerts when bullish and bearish lines crosses
$9.90
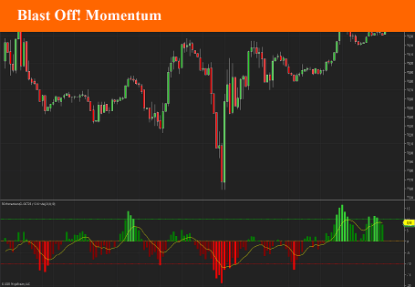
Blast Off! Momentum
This indicator is an alternative interpretation of the Blast Off Indicator by Larry Williams.
This formula takes positive and negative magnitudes rather than the absolute value. The result is then smoothed with an EMA, and twice smoothed to provide a signal line.
Originaly found on tradingview: https://www.tradingview.com/script/fhjAA1Dq-Blast-Off-Momentum-DW/
$9.90
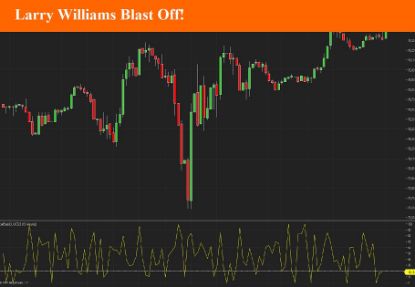
Larry Williams Blast Off!
Indicator designed by Larry Williams, who in 2002 called this indicator Blast Off, which translated means to jump out.
The indicator aims to identify price explosions, both positive and negative. To obtain this result the OPEN and CLOSE values are compared with HIGH and LOW and if the difference between the OPEN and the CLOSE of the day is less than 20% of the range (HIGH-LOW), the explosion is likely to occur of price, or if the absolute value of (OPEN-CLOSE) / HIGH-LOW is less than 20% a Blast Off is expected
This indicator doesn't work on renko bars, or bars where high-low equals open-close.
$9.90
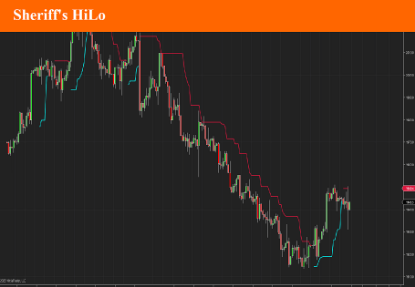
Sheriff's HiLo
Hopefully, nobody shoot the Sherif here.
This confirmation indicator was released recently in the Metatrader ecosystem, and I thought it would be intereting to develop it for the NinjaTrader Paltform.
This indicator has 3 main advantages:
- it is a very broad signals for long trend moves (short or long).
- it is a simple color based identification.
- it has only two settings for quick(er) testing.
The default settings for this indicator returned very interesting results. nut tweaking the settings sometimes give spectacular, sometimes ordinary results.
$9.90
Geometric Mean Moving Average
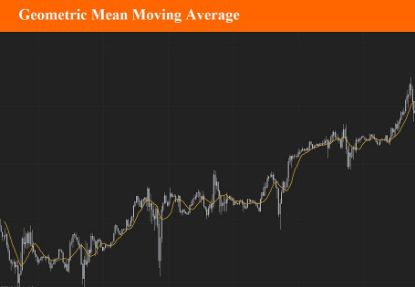
The Geometric moving average calculates the geometric mean of the previous N bars of a time series. The simple moving average uses the arithmetic mean, which means that it is calculated by adding the time series' value of the N previous bars and then dividing the result with the lookback period. The geometric mean on the other hand is calculated by multiplying the time series' N previous values (multiplication is used instead of the addition) and then taking the N'th root product of the last result.
$9.90
DiNapoli MacD (DEMA)
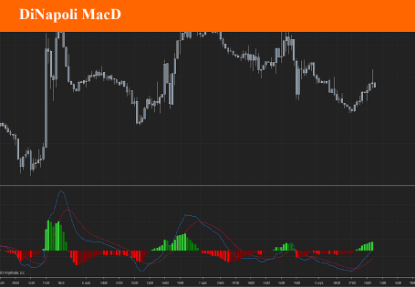
Dinapoli MacD is a trending indicator that give you not only what direction a market is moving but also how volatile the price is. When the market starts giving new max or minimum level values, the Dinapoli macd follows the price trend direction and pulls up the level of quit from the currency market . Stops should be applied where they are for a purpose, and in that case, should not be changed.
The whole idea behind a practical trading plan is to keep it as simple as possible.
There are two main advantages to its use.
1. You are able to determine, one period ahead of time, what price will cause theMACD to turn from a buy to a sell or visa versa. It is a cousin to the Oscillator predictor. If you take a position you know right then and there, the exact price, the current and next (future) bar will need to achieve for the MACD to cross. You can also literally see the distance the market has to go, before your current position is either helped or hindered by the force of the next MACD cross. You can do this in all time frames, as the indicator updates in real time.
2. You are able to determine the “Dynamic Pressure” on the market by clearly observing price action with the MACD history. Dynamic pressure refers to how the market reacts to buy and sell signals. If you get a 30 minute sell on the MACD and the market goes flat for example, you know right then and there that the next buy signal is apt to be a big winner! This was something I would regularly do with the standard DiNapoli MACD but now it is so much easier to see!
$9.90
Volume Flow Indicator
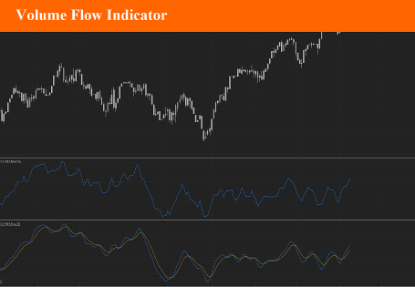
VFI,introduced by Markos Katsanos, is based on the popular On Balance Volume (OBV) but with three very important modifications:
* Unlike the OBV, indicator values are no longer meaningless. Positive readings are bullish and negative bearish.
* The calculation is based on the day's median (typical price) instead of the closing price.
* A volatility threshold takes into account minimal price changes and another threshold eliminates excessive volume.
A simplified interpretation of the VFI is:
* Values above zero indicate a bullish state and the crossing of the zero line is the trigger or buy signal.
* The strongest signal with all money flow indicators is of course divergence.
$9.90
Ehlers Elegant Oscillator
The Elegant Oscillator was created by John Ehlers (Stocks and Commodities Feb 2022 p.21)
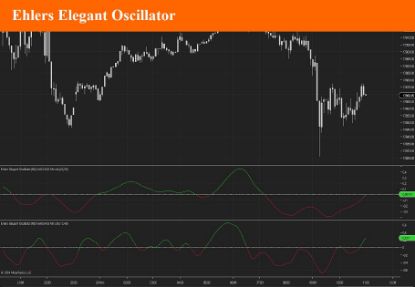
The Elegant Oscillator is founded on the idea that price tend to return to “normal”, or average levels of its historical mean. It calculates the inverse Fisher transform of price and then applies the SuperSmoother to filter market noise and create a signal line.
$9.90
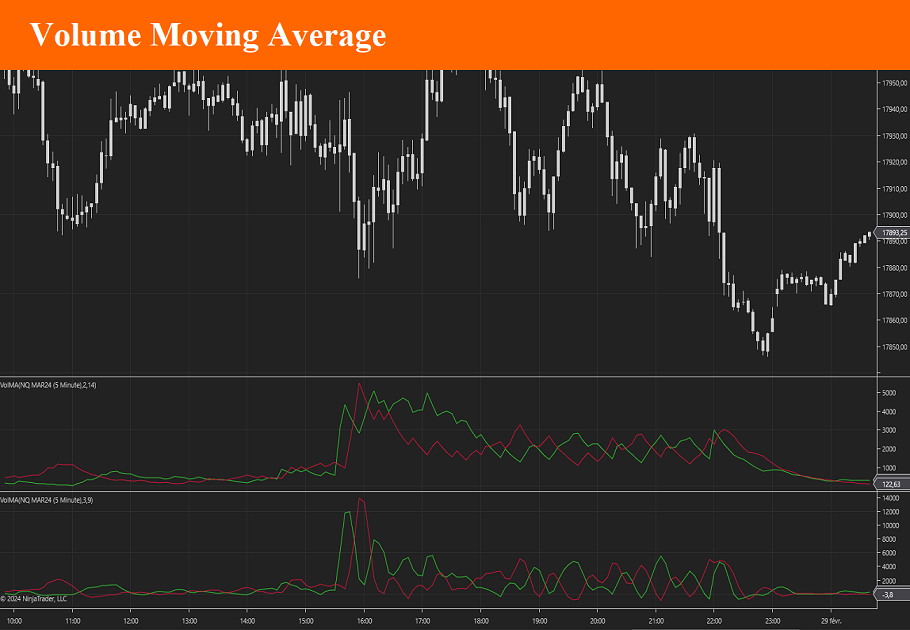
Volume Moving Average
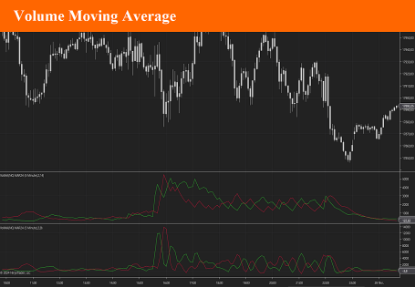
Volume moving average is an indicator based on Ninjatrader Volume Up & Down. It applies a choice of 10 differents moving averages (DEMA, EMA, HMA, LinReg, SMA, TMA, TEMA, VWMA, ZLEMA and WMA). The result is displayed as an "oscillator like" indicator.
Buy and sell signals are given in many different ways, so it's up to you to choose the one that suits you best.
$9.90
Dorsey Inertia
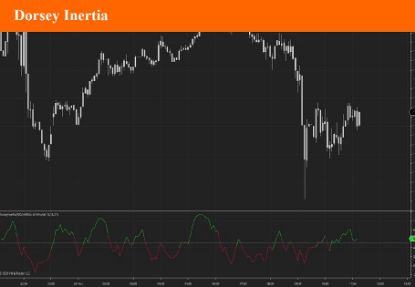
Developed by Donald Dorsey, the Inertia Indicator is an extension of Dorseys Relative Volatility Index and is used to define the long-term trend and how far it has extended. Its name refers to the physics term and its reference to direction and mass of motion.
Dorsey states that a trend is simply the “outward result of inertia” and as such, the market will require much more energy to reverse its direction than to extend the ongoing move.
$9.90
ChartMill Value
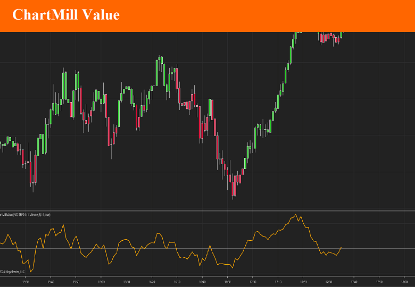
Developed by Dirk Vandycke, ChartMill Value indicator tracks how far the price spread is from its moving average. Since MA keeps increasing even when price consolidates or stalls, it is very difficult for the deviation from a moving average to remain in the overbought or oversold regions for extended periods, which represents a significant improvement over other oscillators such as the RSI and Stochastic indicators.
This indicator is best used with other oscillators, to confirm signals. Zero line crossovers should also be considered as signals.
This indicator will be able to colorize candles according to its trend (> 0 = up trend, < 0 down trend) and send alert when the zeroline is crossed.
$9.90
Top Bottom
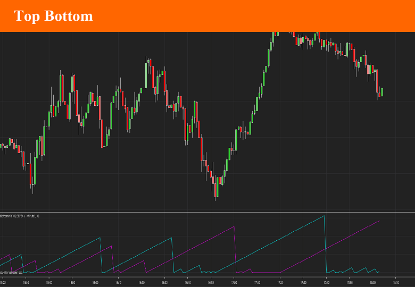
This indicator is a two line cross indicator. It searches for a specific occurrence where the current high price is larger than the last high price and is also larger than the high price a specified number of periods in the past. The same goes for the low.
It looks similar to the Aroon indicator but doesn't work the same way. They may be both used in conjunction.
Buy and Sell signal are given by the crossing of the Longsignal and ShortSignal Lines.
With this indicator you will be able to colorize canbdles according to the trend.
You may also receive alerts when the shjort and long lines are crossing.
$9.90
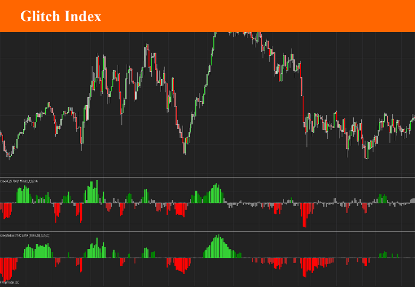
Glitch Index
The Glitch Indicator, commonly referred to as the Glitch Index, is an oscillator used in technical analysis for trading. It was discovered in 2013 and is known for its ability to identify market trends, their strength, and potential reversals. Here are the key features and uses:
Market Trend Identification: The Glitch Index helps traders determine the current market trend, providing insights into whether the market is bullish or bearish.
Trend Strength and Reversals: It assesses the strength of a trend and indicates potential points where the trend might reverse .
Trend Filtering: The indicator includes a trend filter to screen out false signals, improving the reliability of the trends it identifies
$9.90
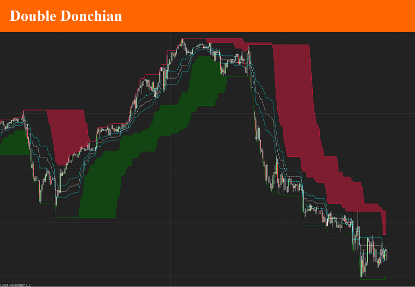
Double Donchian
The double donchian indicator is the association between two donchian channel, each with different period parameter.
Using the fast and slow Donchian channels you'll be able to get long and short trading signals. When the price crosses the slow channel, open long or short positions. When the price crosses the fast channel again, close the positions.
You may also use it as a trend indicator by checking the differences between channel 1 low and channel 2 low values and channel 1 and channel 2 high value.
A set of 3 Fibonacci lines will complete this indicator.
$9.90
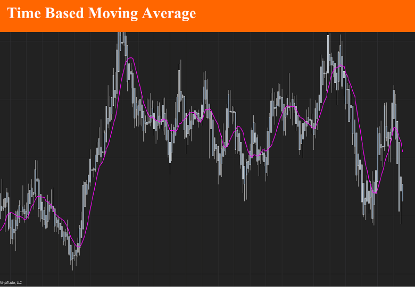
Time based moving average
A time-based moving average is a technique used to calculate the average of data points over a specific period. Unlike traditional moving averages that use a fixed number of samples, a time-based moving average adjusts based on the actual time that has passed. This method is useful in scenarios where data sampling intervals are irregular or where the importance lies in the time duration rather than the count of samples. This is mostly the case in non-time based timeframe such as Renko.
$9.90
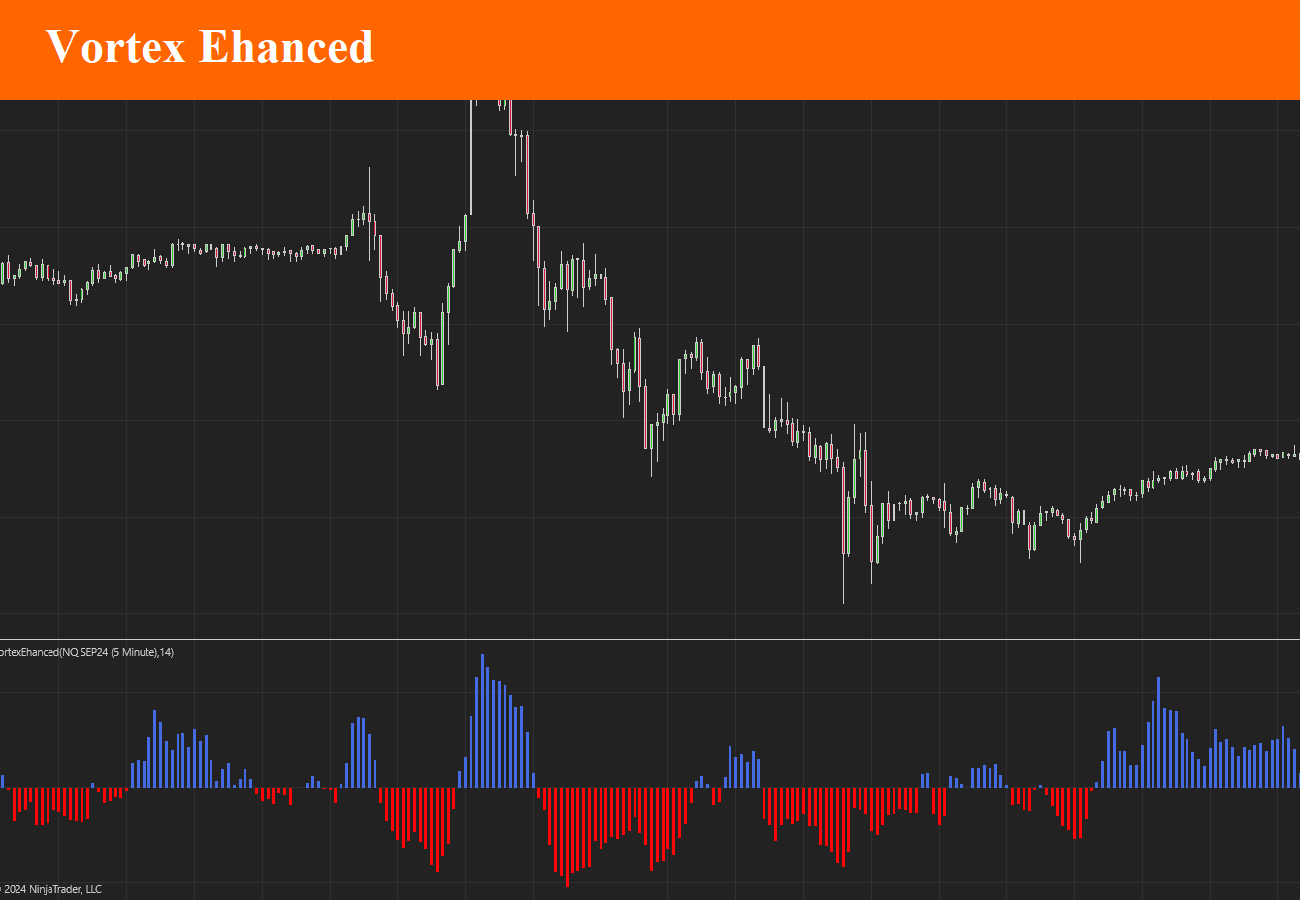
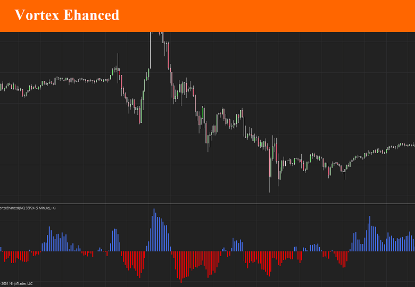
Vortex Ehanced
The Vortex Indicator is a technical analysis tool used in financial markets to identify the start of a new trend or the continuation of an existing trend. It was developed by Etienne Botes and Douglas Siepman in 2010 and is based on the work of J. Welles Wilder, who created the Average Directional Index (ADX). The Vortex Indicator focuses on the relationship between the highs and lows of prices to determine the strength and direction of a market trend.
$9.90
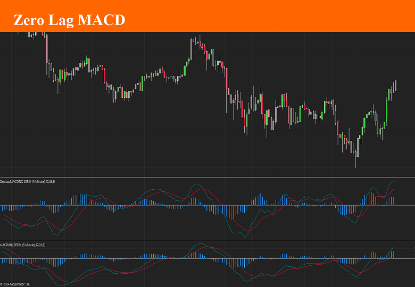
Zero Lag MACD
The Zero Lag MACD (Moving Average Convergence Divergence) is a variation of the traditional MACD indicator, designed to reduce the inherent lag in the original MACD, providing traders with faster and more responsive signals. By doing so, it aims to give earlier warnings of potential trend changes or reversals.
$9.90
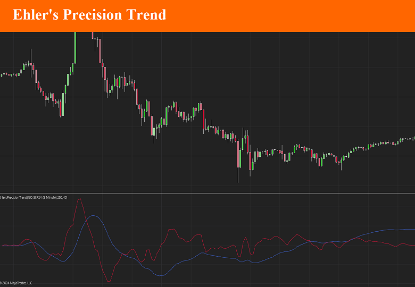
Ehler's Precision Trend
Ehler's Precision Trend Indicator (EPTI), developed by John Ehlers, is a technical analysis tool designed to identify market trends with high accuracy and minimal lag. John Ehlers is known for his work on applying digital signal processing techniques to technical analysis, and the Precision Trend Indicator is one of his innovative contributions aimed at improving the detection of price trends in financial markets.
$9.90
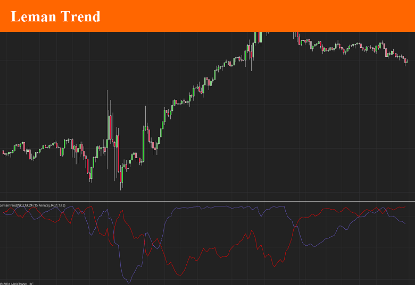
Leman
The LeMan Trend Indicator is a trend-following tool commonly used in trading platforms like MetaTrader 4 (MT4), MetaTrader 5 (MT5), and TradingView. This is why we developed it for the Ninjatyrader 8 platform. It is designed to help traders identify market trends by generating buy and sell signals based on price movements. This indicator works best as a support tool to other main indicators, serving as a signal filter to refine entry and exit points.
$9.90
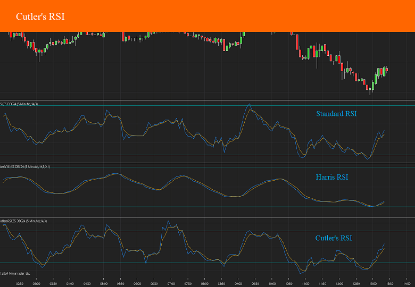
Cutler's RSI
Cutlers RSI is a simple moving average based version of the popular Relative Strength Index momentum oscillator which was developed by J. Welles Wilder and detailed in his book New Concepts in Technical Trading Systems. It analyses Average Gains and Average Losses to measure the speed and magnitude of price movements.
The RSI is always between 0 and 100, with stocks above 70 considered overbought and stocks below 30 oversold. Divergence between the price and RSI can also be analysed for potential reversals.
Average Gain is calculated as an SMA of the gains in the Period. The Average Loss is similarly calculated using Losses.
$9.90
Harris RSI
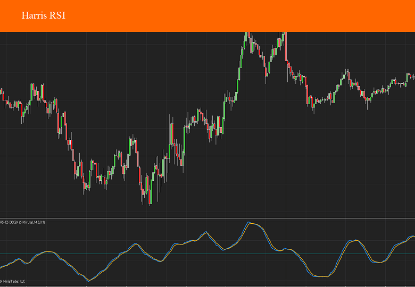
Harris RSI is a variation of the standard Relative Strength Index (RSI) used in technical analysis. This indicator follows similar principles to the classic RSI by indicating overbought or oversold conditions in an asset, helping traders assess momentum and trend changes. However, specific features distinguish it:
Trend OB/OS: It signals an uptrend when above the overbought level and a downtrend when below the oversold level.
Overbought/Oversold Indicator: Values above a certain threshold (overbought) or below a certain threshold (oversold) indicate potential price reversals.
50-Cross Signal: Crossing above the 50 line suggests bullish momentum, while a drop below indicates bearish momentum[1].
This variant provides an additional layer of nuance for trend analysis, focusing on trend strength as well as reversal points.
$9.90
Asymmetrical RSI
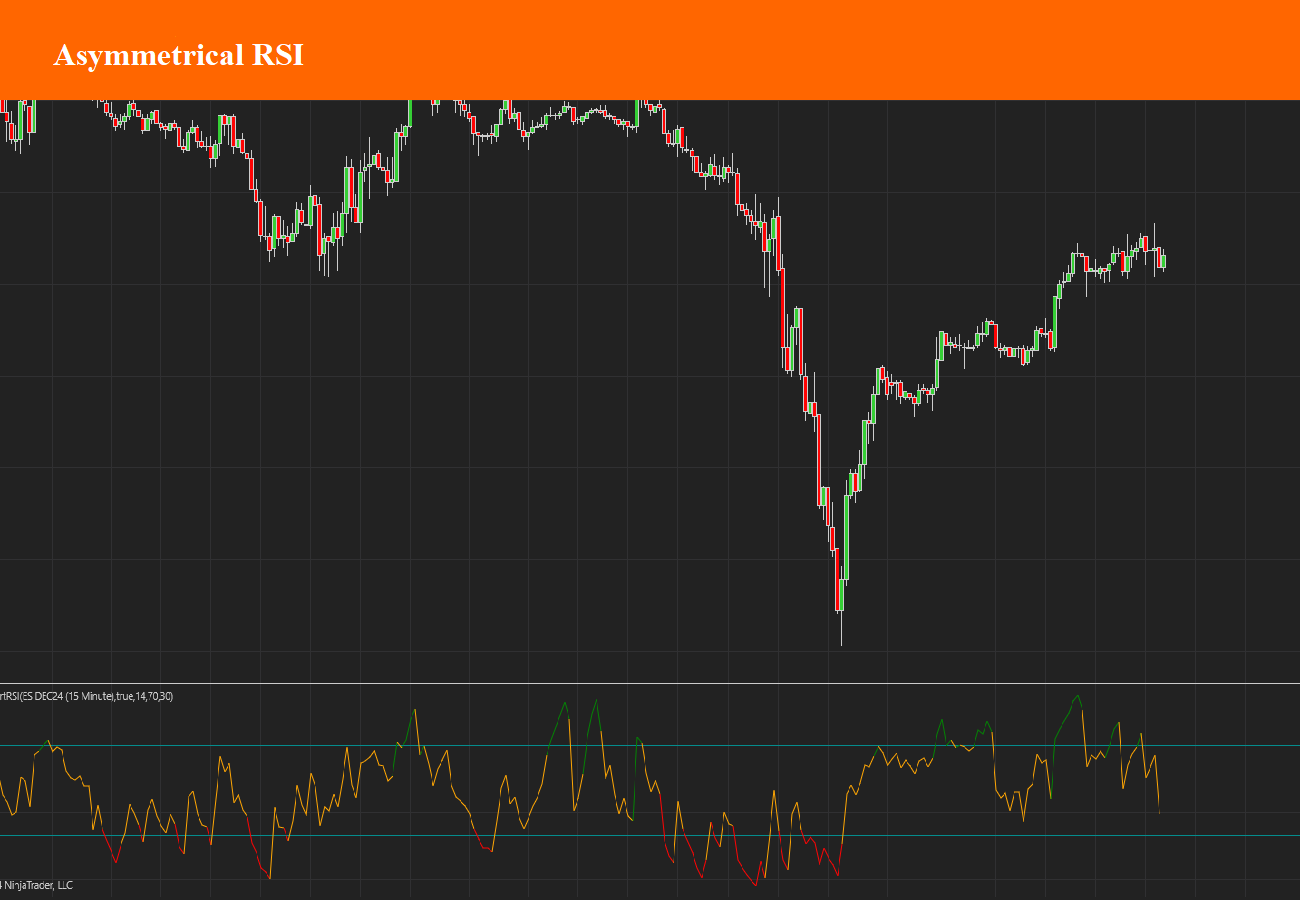
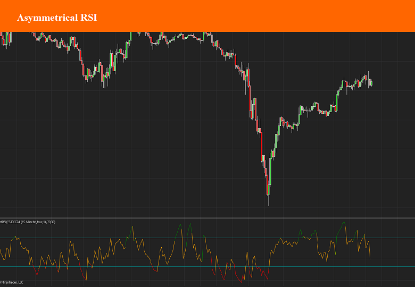
ARSI, or the Asymmetrical Relative Strength Index, is a technical indicator that builds upon the traditional Relative Strength Index (RSI) by focusing on smoothing out market noise to identify trends more clearly. It was developed by Sylvain Vervoort to address some limitations of the standard RSI by using asymmetrical adjustments. This adaptation aims to provide clearer signals for entry and exit points in trading by making trend direction and strength more evident in volatile markets.
The ARSI modifies the original RSI calculation by using a moving average and standard deviation to help filter out noise, improving the accuracy of identifying significant market moves. This can help traders respond earlier to market changes, with ARSI designed particularly for detecting both bullish and bearish momentum shifts more effectively
$9.90
SineWMA
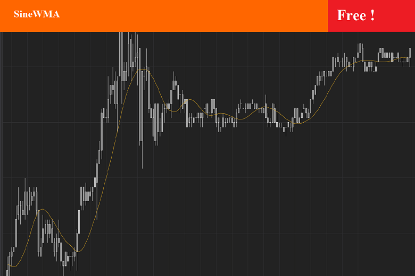
The Sine Weighted Moving Average (SineWMA) is a type of moving average that uses a sine function as a weighting mechanism for price data. Unlike simple or exponential moving averages, the SineWMA applies weights in a sinusoidal pattern, giving more emphasis to certain data points based on their position in the series. This can make the SineWMA smoother and potentially more responsive to cycles in market data.
$0.00
Ultimate Strength Index
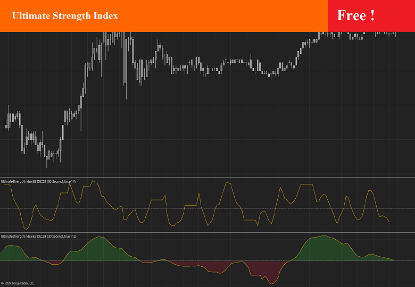
This indicator implements the Ultimate Strength Index (USI) indicator, introduced by John Ehlers in his article titled "Ultimate Strength Index (USI)" from the November 2024 edition of TASC's Traders' Tips. The USI is a modified version of Wilder's original Relative Strength Index (RSI) that incorporates Ehlers' UltimateSmoother lowpass filter to produce an output with significantly reduced lag.
$0.00
Heiken Ashi Smoothed Bar Type
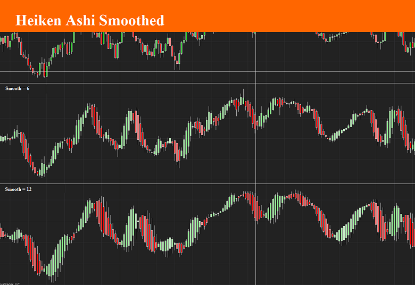
The Heiken Ashi Smoothed Bar Type is a variation of the standard Heiken Ashi candlesticks. It uses a moving average or smoothing algorithm to calculate the open, high, low, and close prices. This bar type reduces market noise, making trends more visually apparent and helping traders identify long-term trends by filtering out short-term fluctuations.
$19.90
VWap Bars
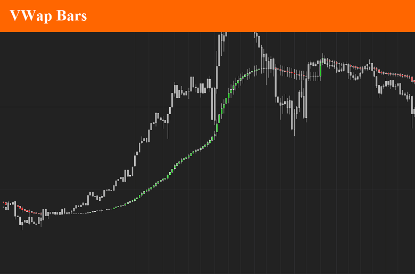
VWAP Bars (Volume Weighted Average Bars) are candlestick charts where each candle is based on the VWAP instead of the traditional open-high-low-close (OHLC) price. VWAP is a trading indicator that calculates the average price a security has traded at throughout the day, weighted by volume. It provides a clearer picture of the market's average trading price, especially in intraday trading.
$9.90
HLC Trend
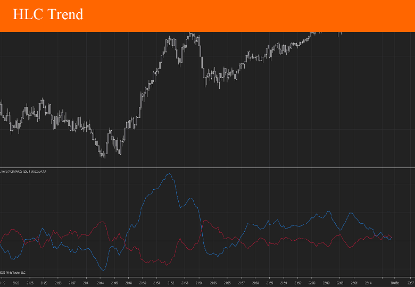
The HLC Trend Indicator is a technical analysis tool used in trading to identify trends and potential entry/exit points in the market. It is based on the High, Low, and Close (HLC) prices of an asset, which are key components of candlestick or bar charts
$9.90
Volume Price Trend
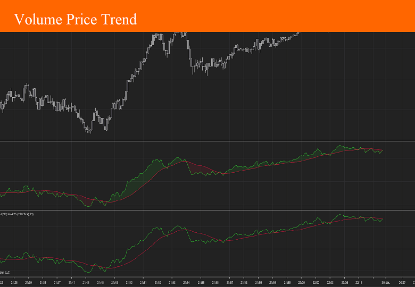
The Volume Price Trend (VPT) indicator combines price movement with volume to give a cumulative measure of the trend. It is similar to the On-Balance Volume (OBV) indicator but adds a weighting of the price change relative to the volume. This helps identify the strength of a trend by considering both price and volume together.
$9.90
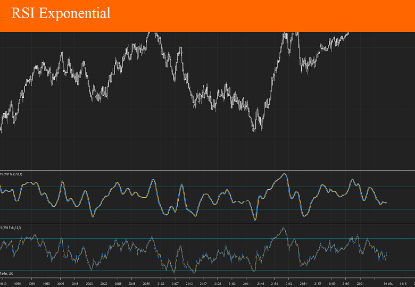
RSI Exponential
The Relative Strength Index Exponential indicator is a variation of the traditional RSI (Relative Strength Index). The main difference is that it uses exponential smoothing instead of simple moving averages. This gives this indicator more sensitivity to recent price changes, which can be helpful in identifying potential reversals more quickly.
$9.90
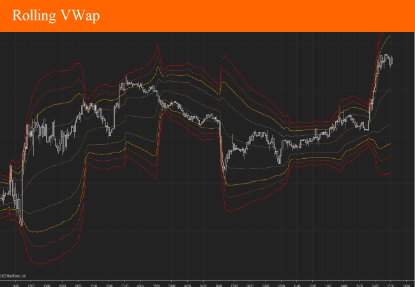
Rolling VWap
The Rolling VWAP (Volume-Weighted Average Price) is a variation of the standard VWAP that calculates the VWAP over a rolling (fixed-length) period instead of resetting at the start of each trading session. This makes it useful for tracking VWAP trends over intraday or multi-day periods.
$9.90
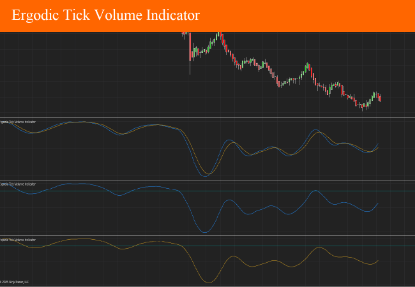
Ergodic Tick Volume Indicator
The William Blau Ergodic Tick Volume Indicator is a variation of the Ergodic Oscillator developed by William Blau. It uses tick volume instead of price for its calculation, making it particularly useful for traders who focus on volume-driven signals rather than price action alone.
$9.90
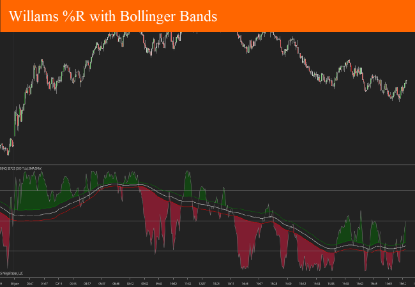
Williams %R with Bollinger Bands
The Williams %R w/ Bollinger Bands indicator is a combined technical analysis tool that overlays the Williams %R momentum oscillator with Bollinger Bands to enhance the identification of overbought and oversold market conditions.
$9.90
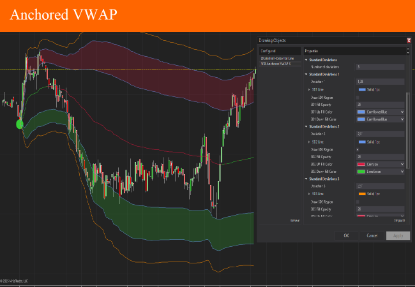
Anchored VWAP with Deviations
Anchored VWAP (Volume Weighted Average Price) is a technical analysis indicator, presented here as a Ninjatrader 8 Drawing Tool, that calculates the average price of a security, weighted by volume, starting from a specific point (the "anchor") chosen by the trader or analyst. This is different from the standard VWAP, which typically starts at the beginning of the trading day and ends at the close.
$9.90
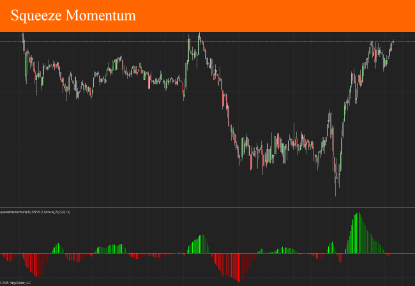
Squeeze Momentum
The Squeeze Momentum Indicator (often called "TTM Squeeze" or just "Squeeze") is a technical analysis tool used by traders to identify periods when a security is likely to experience increased volatility and potential price breakouts.
This version is a derivative of John Carter's "TTM Squeeze" volatility indicator, as discussed in his book "Mastering the Trade" (chapter 10).
$9.90
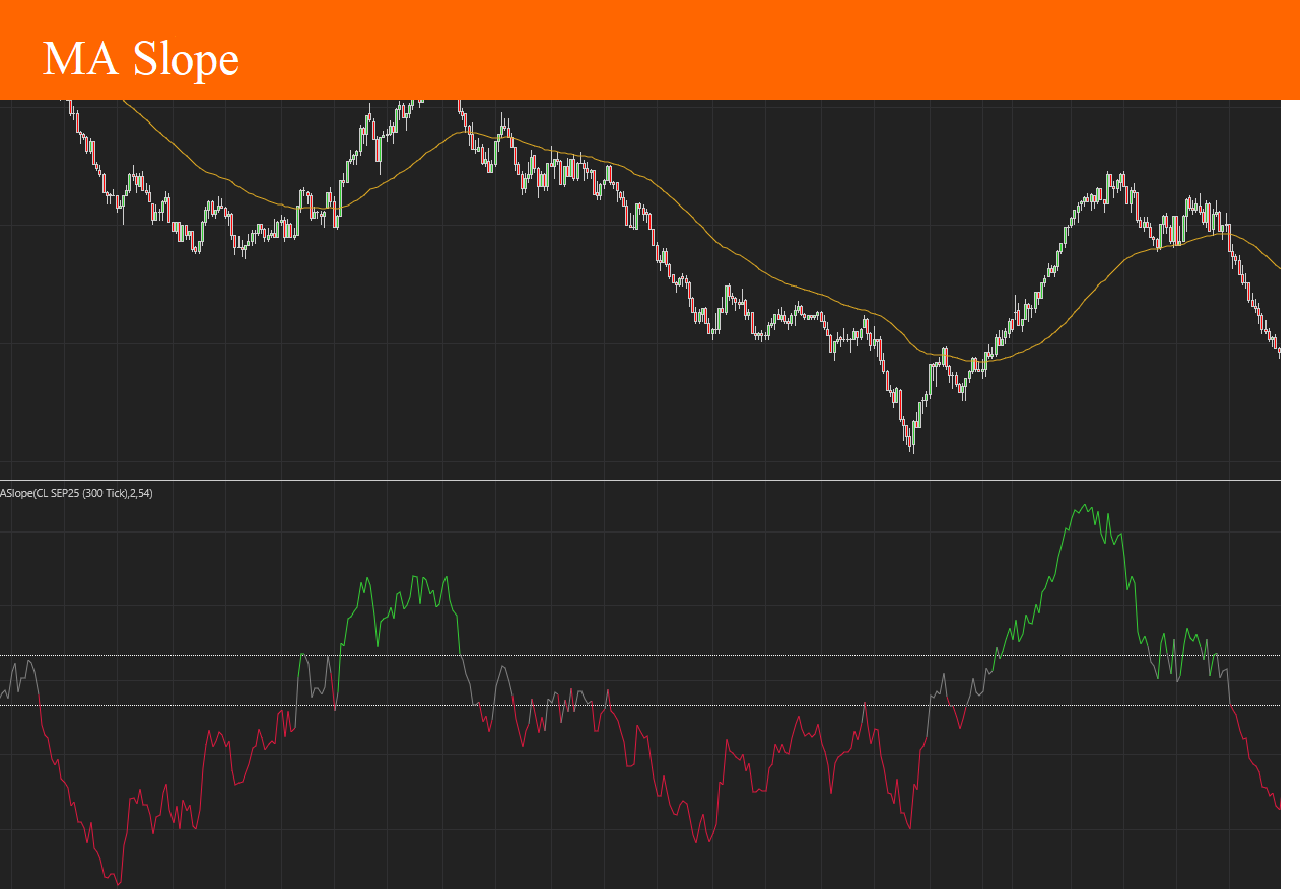
Moving Average Slope
The MA Slope indicator (Moving Average Slope) is a technical analysis tool used in trading and investing to measure the direction and steepness (rate of change) of a moving average over time. Instead of just tracking the value of a moving average (like SMA or EMA), the MA Slope indicator quantifies how quickly that average is rising or falling—essentially, it calculates the gradient or "slope" of the moving average line.
$9.90
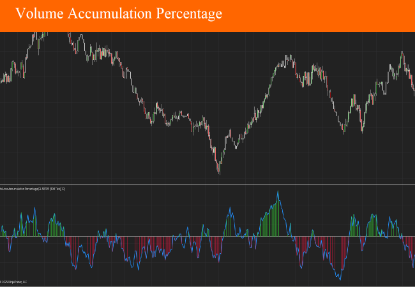
Volume Accumulation Percentage
The Volume Accumulation Percentage (VAP) indicator is a technical analysis tool used primarily to measure the flow of volume in relation to price movements over a specific period. It helps traders and analysts assess the strength and conviction behind price trends by looking at how much of the trading volume is being “accumulated” (associated with upward price movement) versus “distributed” (associated with downward price movement).
$9.90
Bestsellers
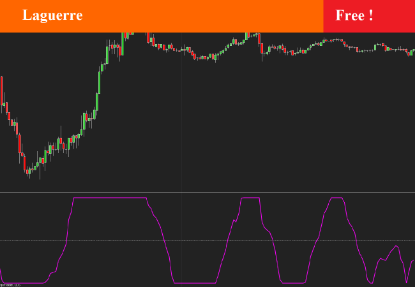
Laguerre
Laguerre RSI is based on John EHLERS' Laguerre Filter to avoid the noise of RSI . As such, it is possible to use it to plot trend changes more precisely - and thus open and close positions at these points.
$0.00
Larry Williams Large Trade Index
Larry Williams Large Trade Index (LWTI) is an indicatory by Larry Williams as explained in his book "Trade Stocks and Commodities with the Insiders: Secrets of the COT Report".
The original concept was specifically based on Trader (or Market) Sentiment and predicting market reversals.
$9.90
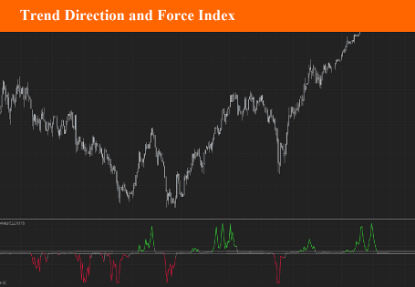
Trend Direction and Force Index
Developed by psychologist and trader Alexander Elder, it was first published in his 1993 book, “Trading for a Living”. This indicator is an oscillator that swings between 1 and -1 and can be qualified as a zero cross by combining both price movement and volume. It has the added advantage of displaying a neutral zone where no significant bull or bear “force” exists, and the market has no distinct direction. This area is between -0.05 and +0.05 as noted on the indicator levels.
$9.90
Ultimate Strength Index
This indicator implements the Ultimate Strength Index (USI) indicator, introduced by John Ehlers in his article titled "Ultimate Strength Index (USI)" from the November 2024 edition of TASC's Traders' Tips. The USI is a modified version of Wilder's original Relative Strength Index (RSI) that incorporates Ehlers' UltimateSmoother lowpass filter to produce an output with significantly reduced lag.
$0.00
Telegram Share Service
Telegram ShareService is the easiest way for you to receive alarms or notifications from Ninjatrader on your Telegram Group, on Mobile or Desktop.
The Telegram ShareService for Ninjatrader 8 was developed for several purposes, but mainly for those who are willing to setup signal groups.
With Telegram Share service, you can easily share indicators alerts, orders alert (open, close, TP/SL), or NinjaTrader alerts. It is highly integrable inside your strategies.
$19.90
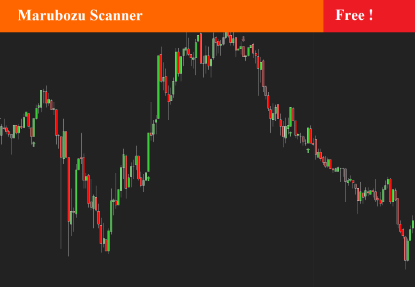
Marubozu Scanner
Marubozus are an interesting candle pattern wherein the close and open of the candle are also the high / low points of the candle. In other words, a candle with no shadows or wicks.
How reliable are they, though? Probably not very reliable on their own. It may also depend on the size of the candle. You would probably want to incorporate this candle pattern with other filters, like RSI , MACD , to filter trade opportunities.
$0.00
