Cookies help us deliver our services. By using our services, you agree to our use of cookies.
You have no items in your shopping cart.
Filter by price
nt8Indicators
nt8indicator is a software editor dedicated to the trading world, and more specifically to ninjatrader 8.x
Our goal is to provide you with efficient, inexpensive and easy to use indicators.Some description...
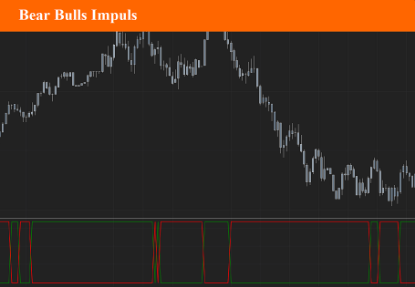
Bears Bulls Impulse
This indicator is an adaptation of the Elder Ray Index indicator developed by Dr. Alexander Elder. The original version was developed in 1989 and was given the name Elder “Ray” because he felt it could see through the market, just as an X-Ray can see your bones through your skin.
$9.90
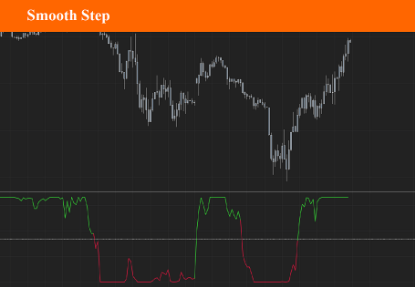
Smooth Step
This indicator was adopted from work done by a very smart guy named Kenneth H. Perlin, who is a professor at New York University in the Computer Science Department. His work centered around something called “Sigmoid Function” having a characteristic “S”-shaped curve or sigmoid curve
$9.90
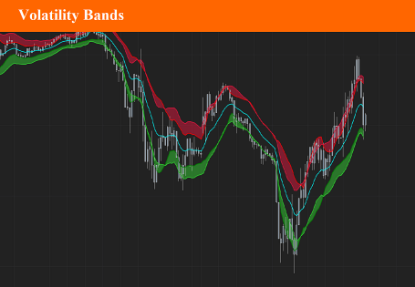
Volatility Bands
The Volatility Bands indicator, attempts to present a way to measure and visualize volatility, using standard deviations (σ) and average true range indicator, and aims to point out areas that might indicate potential trading opportunities. Volatility Bands indicator combines the approach of both Bollinger Bands and Keltner Channel, with different settings and different visualization
$9.90
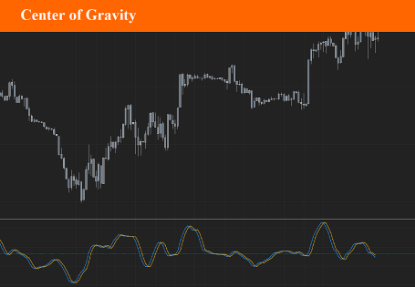
Center of Gravity
The Stochastic Center Of Gravity Indicator was created by John Ehlers (Stocks and Commodities Magazine) It provides a pretty accurate way to see how the stock is trending. If the indicator stays above 0 then the stock is in a pretty strong uptrend and if it stays below 0 then the stock is in a pretty strong downtrend. Buy when the indicator changes crosses 0 upward and sell when it crosses downward.
$9.90
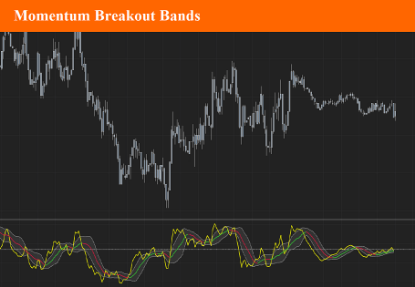
Momentum Breakout Bands
These bands are bollinger bands that have an adjusted standard deviation. There are Buy signals when it has momentum breakouts above the bands for moves to the upside and Sell signals when it has momentum breakouts below the bands for moves to the downside. The bands simply suggest that all markets have periods of chop which we all know to be true. While the price is inside the bands it is said to be trendless. Once the breakouts happen you can take trades in the breakout direction. The bands should work on most instruments and timeframes
$9.90
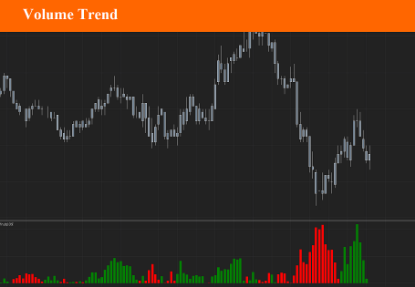
Volume Trend
Volume Trend is a variation of standard Volume Up/Down indicator. Its originality is to apply Simple moving average on volume, and display the difference between Up and Down volume on an histogram. It is a very usefull way to view the change and spike in volume very quickly. This is a great indicator for scalpers.
$9.90
