Cookies help us deliver our services. By using our services, you agree to our use of cookies.
You have no items in your shopping cart.
Filter by price
nt8Indicators
nt8indicator is a software editor dedicated to the trading world, and more specifically to ninjatrader 8.x
Our goal is to provide you with efficient, inexpensive and easy to use indicators.Some description...
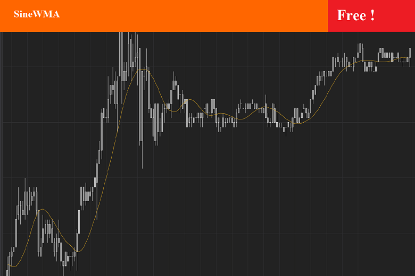
SineWMA
The Sine Weighted Moving Average (SineWMA) is a type of moving average that uses a sine function as a weighting mechanism for price data. Unlike simple or exponential moving averages, the SineWMA applies weights in a sinusoidal pattern, giving more emphasis to certain data points based on their position in the series. This can make the SineWMA smoother and potentially more responsive to cycles in market data.
$0.00
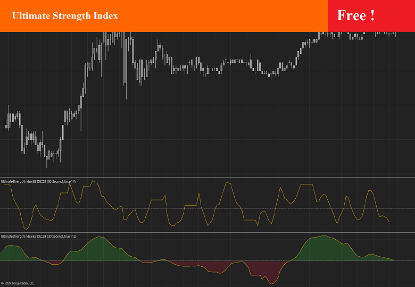
Ultimate Strength Index
This indicator implements the Ultimate Strength Index (USI) indicator, introduced by John Ehlers in his article titled "Ultimate Strength Index (USI)" from the November 2024 edition of TASC's Traders' Tips. The USI is a modified version of Wilder's original Relative Strength Index (RSI) that incorporates Ehlers' UltimateSmoother lowpass filter to produce an output with significantly reduced lag.
$0.00
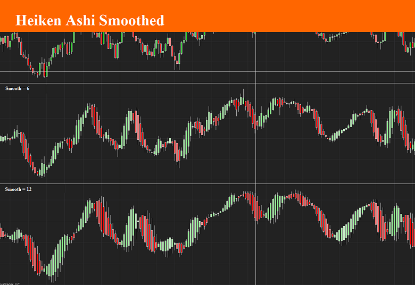
Heiken Ashi Smoothed Bar Type
The Heiken Ashi Smoothed Bar Type is a variation of the standard Heiken Ashi candlesticks. It uses a moving average or smoothing algorithm to calculate the open, high, low, and close prices. This bar type reduces market noise, making trends more visually apparent and helping traders identify long-term trends by filtering out short-term fluctuations.
$19.90
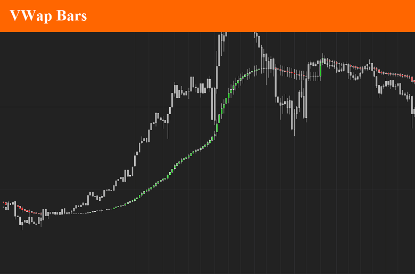
VWap Bars
VWAP Bars (Volume Weighted Average Bars) are candlestick charts where each candle is based on the VWAP instead of the traditional open-high-low-close (OHLC) price. VWAP is a trading indicator that calculates the average price a security has traded at throughout the day, weighted by volume. It provides a clearer picture of the market's average trading price, especially in intraday trading.
$9.90
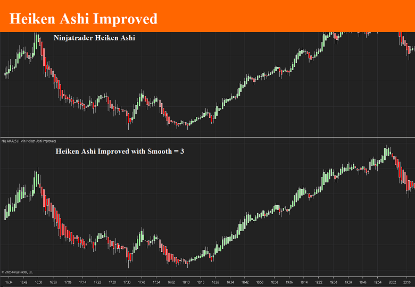
Heiken Ashi Improved
Heiken Ashi Improved Bar Types are a variation of the traditional Heiken Ashi (HA) bars, which are designed to offer smoother trends and better clarity by adjusting the bar's open, close, high, and low values in a unique way. The primary difference between the traditional Heiken Ashi and the "improved" version is that the improved version can be adjusted to more accurately reflect price action trends while reducing noise.
$9.90
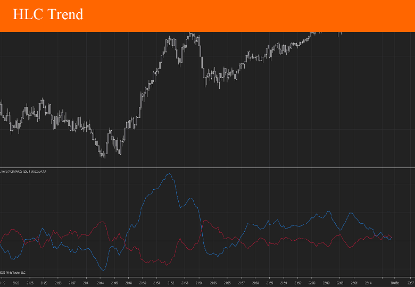
HLC Trend
The HLC Trend Indicator is a technical analysis tool used in trading to identify trends and potential entry/exit points in the market. It is based on the High, Low, and Close (HLC) prices of an asset, which are key components of candlestick or bar charts
$9.90
