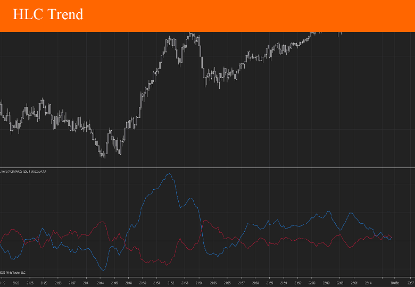
HLC Trend
The HLC Trend Indicator is a technical analysis tool used in trading to identify trends and potential entry/exit points in the market. It is based on the High, Low, and Close (HLC) prices of an asset, which are key components of candlestick or bar charts
$9.90
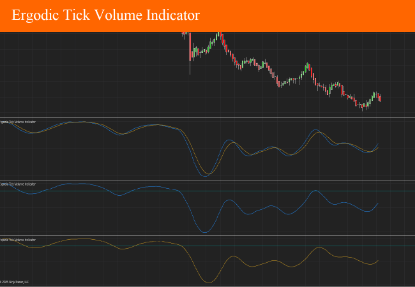
Ergodic Tick Volume Indicator
The William Blau Ergodic Tick Volume Indicator is a variation of the Ergodic Oscillator developed by William Blau. It uses tick volume instead of price for its calculation, making it particularly useful for traders who focus on volume-driven signals rather than price action alone.
$9.90
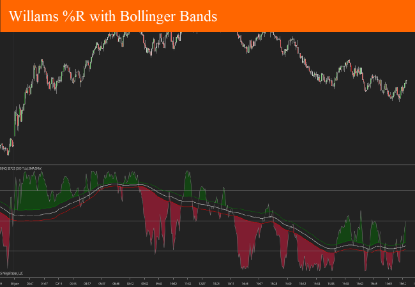
Williams %R with Bollinger Bands
The Williams %R w/ Bollinger Bands indicator is a combined technical analysis tool that overlays the Williams %R momentum oscillator with Bollinger Bands to enhance the identification of overbought and oversold market conditions.
$9.90
Moving Average Slope
The MA Slope indicator (Moving Average Slope) is a technical analysis tool used in trading and investing to measure the direction and steepness (rate of change) of a moving average over time. Instead of just tracking the value of a moving average (like SMA or EMA), the MA Slope indicator quantifies how quickly that average is rising or falling—essentially, it calculates the gradient or "slope" of the moving average line.
$9.90


